Creating an Animated Flow Chart in After Effects
Introduction
Flow charts are an excellent way to present data visually. By animating them in After Effects, you can create engaging and professional-looking infographics. In this tutorial, you will learn how to animate a flow chart using shape layers, expressions, and slider controls.
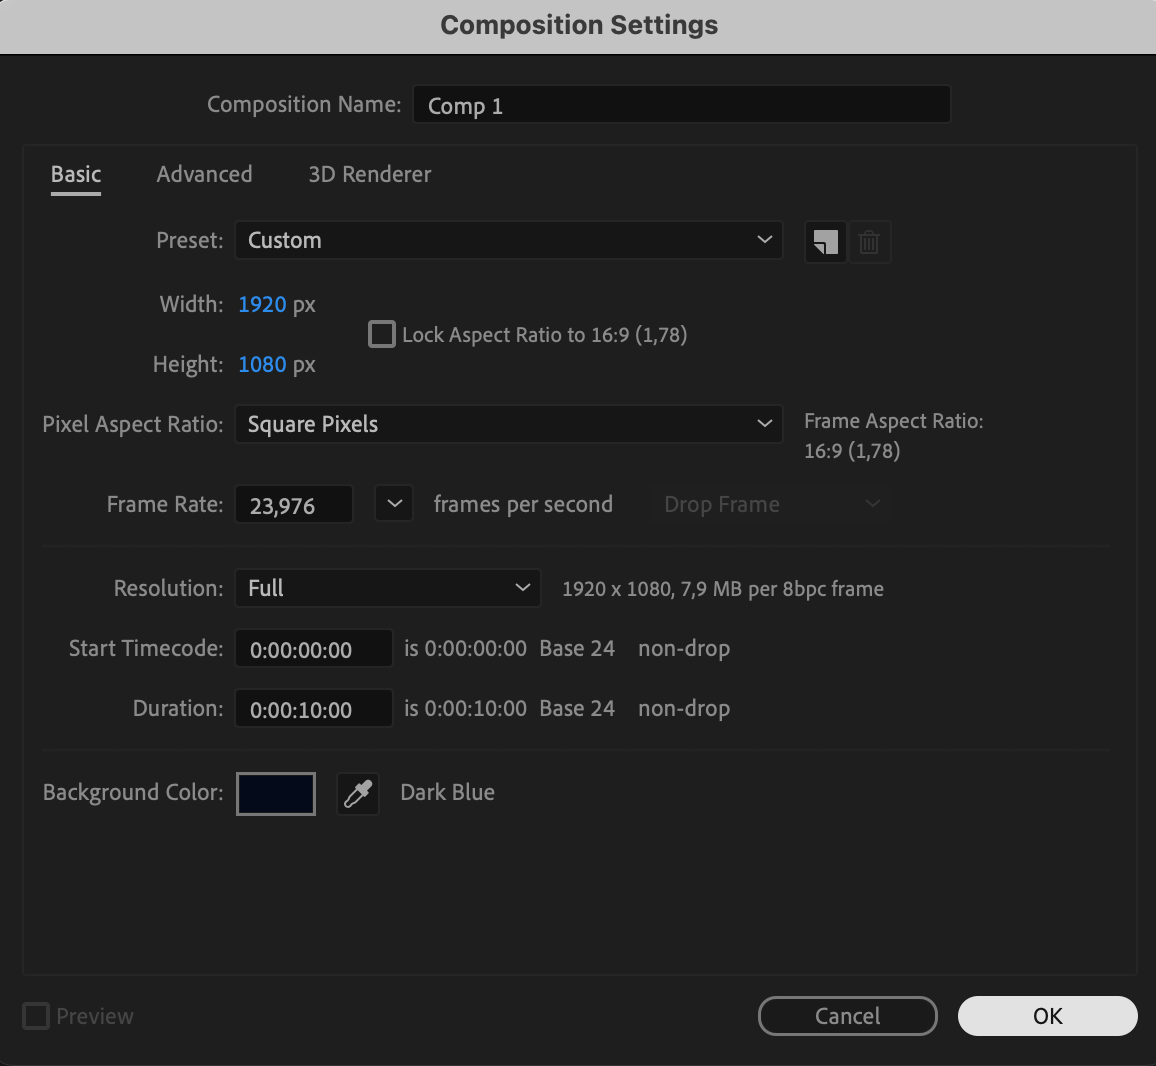
Step 1: Create a New Composition
Open After Effects and create a new composition. Set the resolution, frame rate, and duration according to your project requirements.

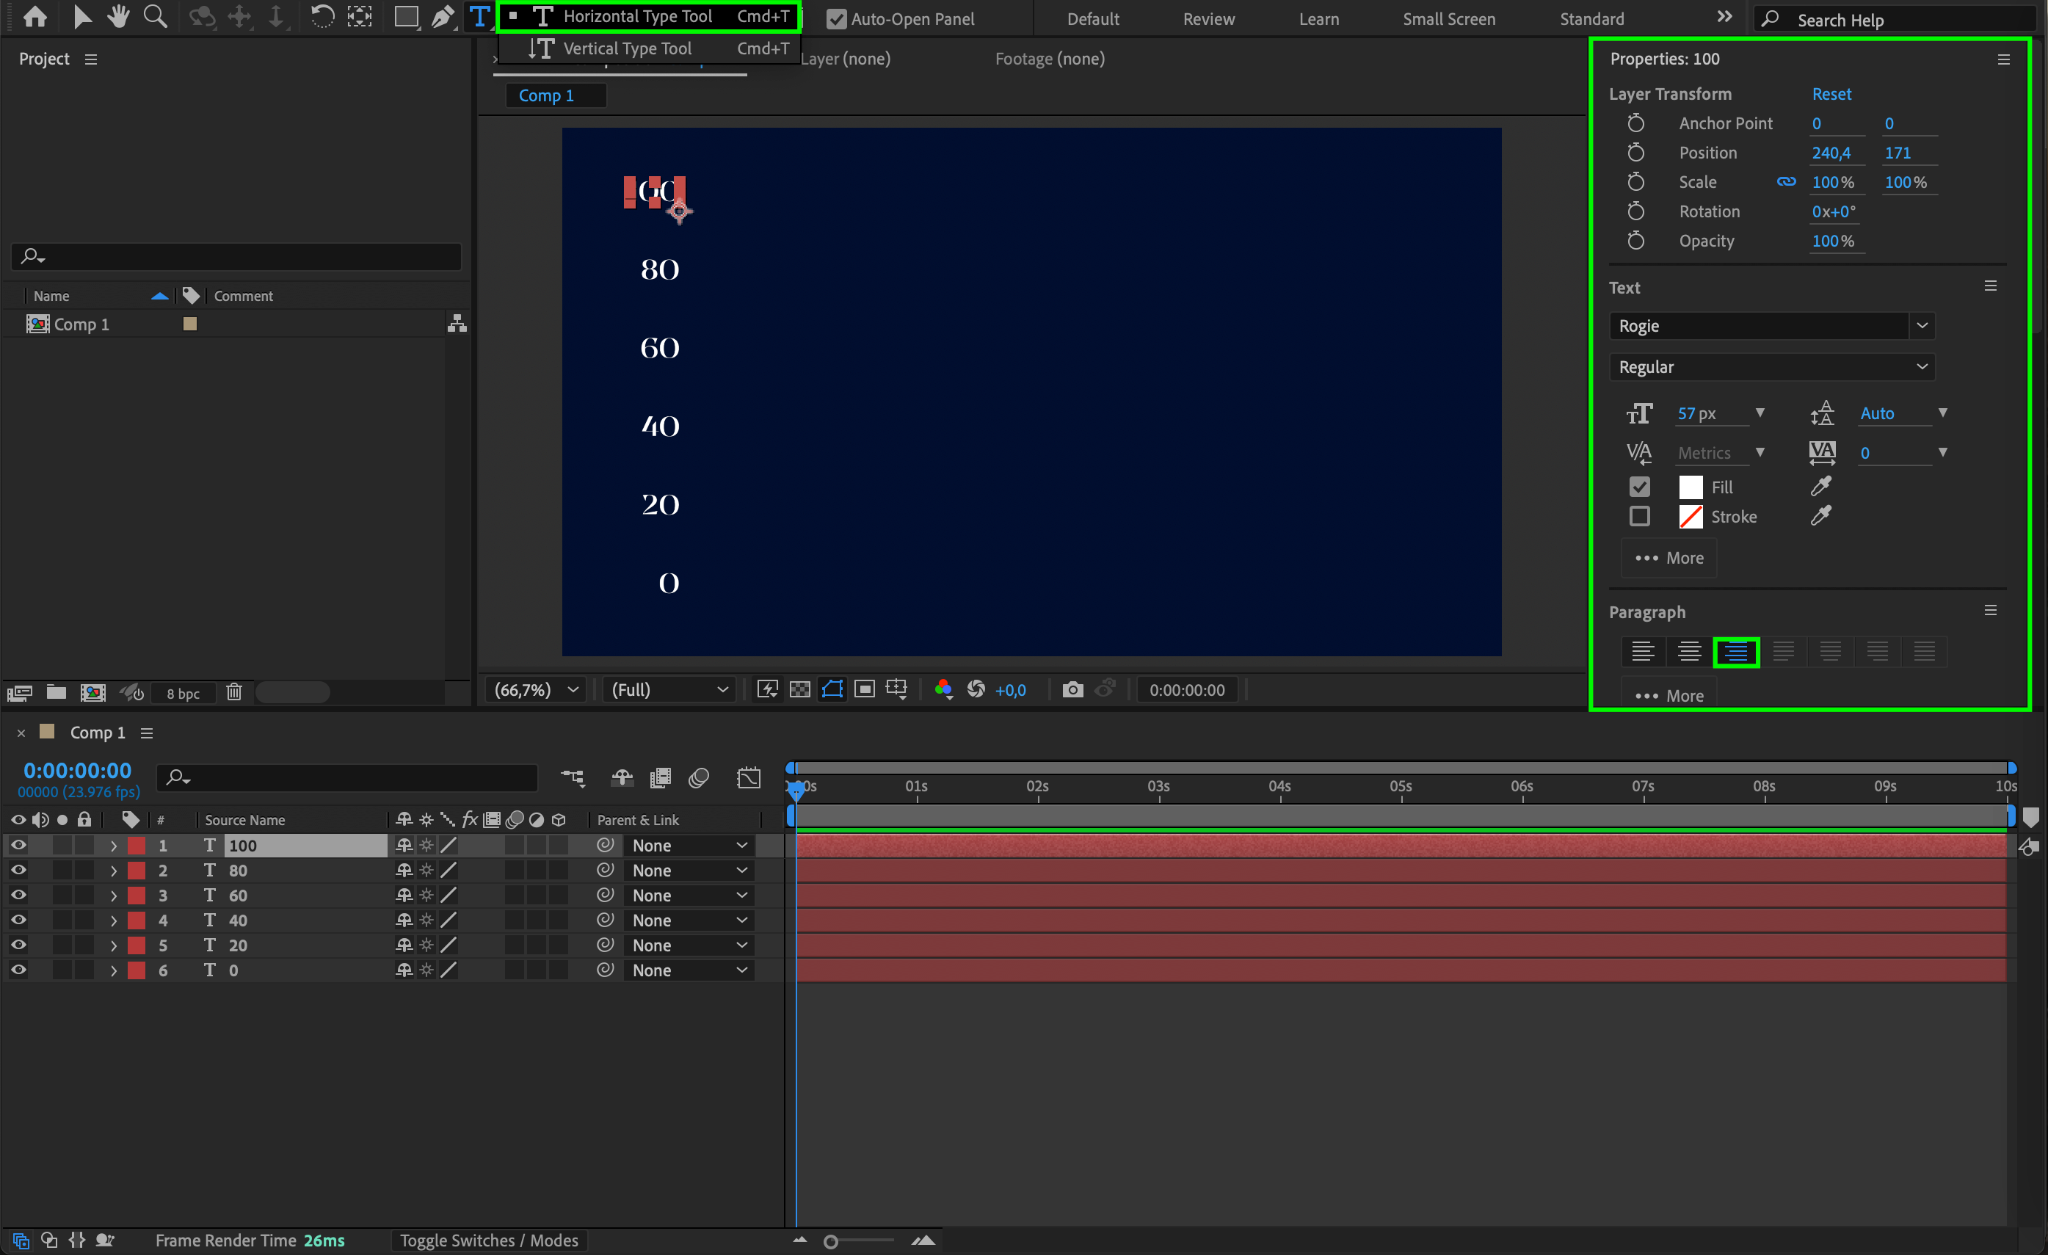
Step 2: Add Text for Chart Levels
Use the Type Tool (Ctrl/Cmd + T) to create text layers representing different levels of the chart (e.g., 100, 80, 60, 40, 20, 0). Align them to the right using the Paragraph Panel for a structured look.
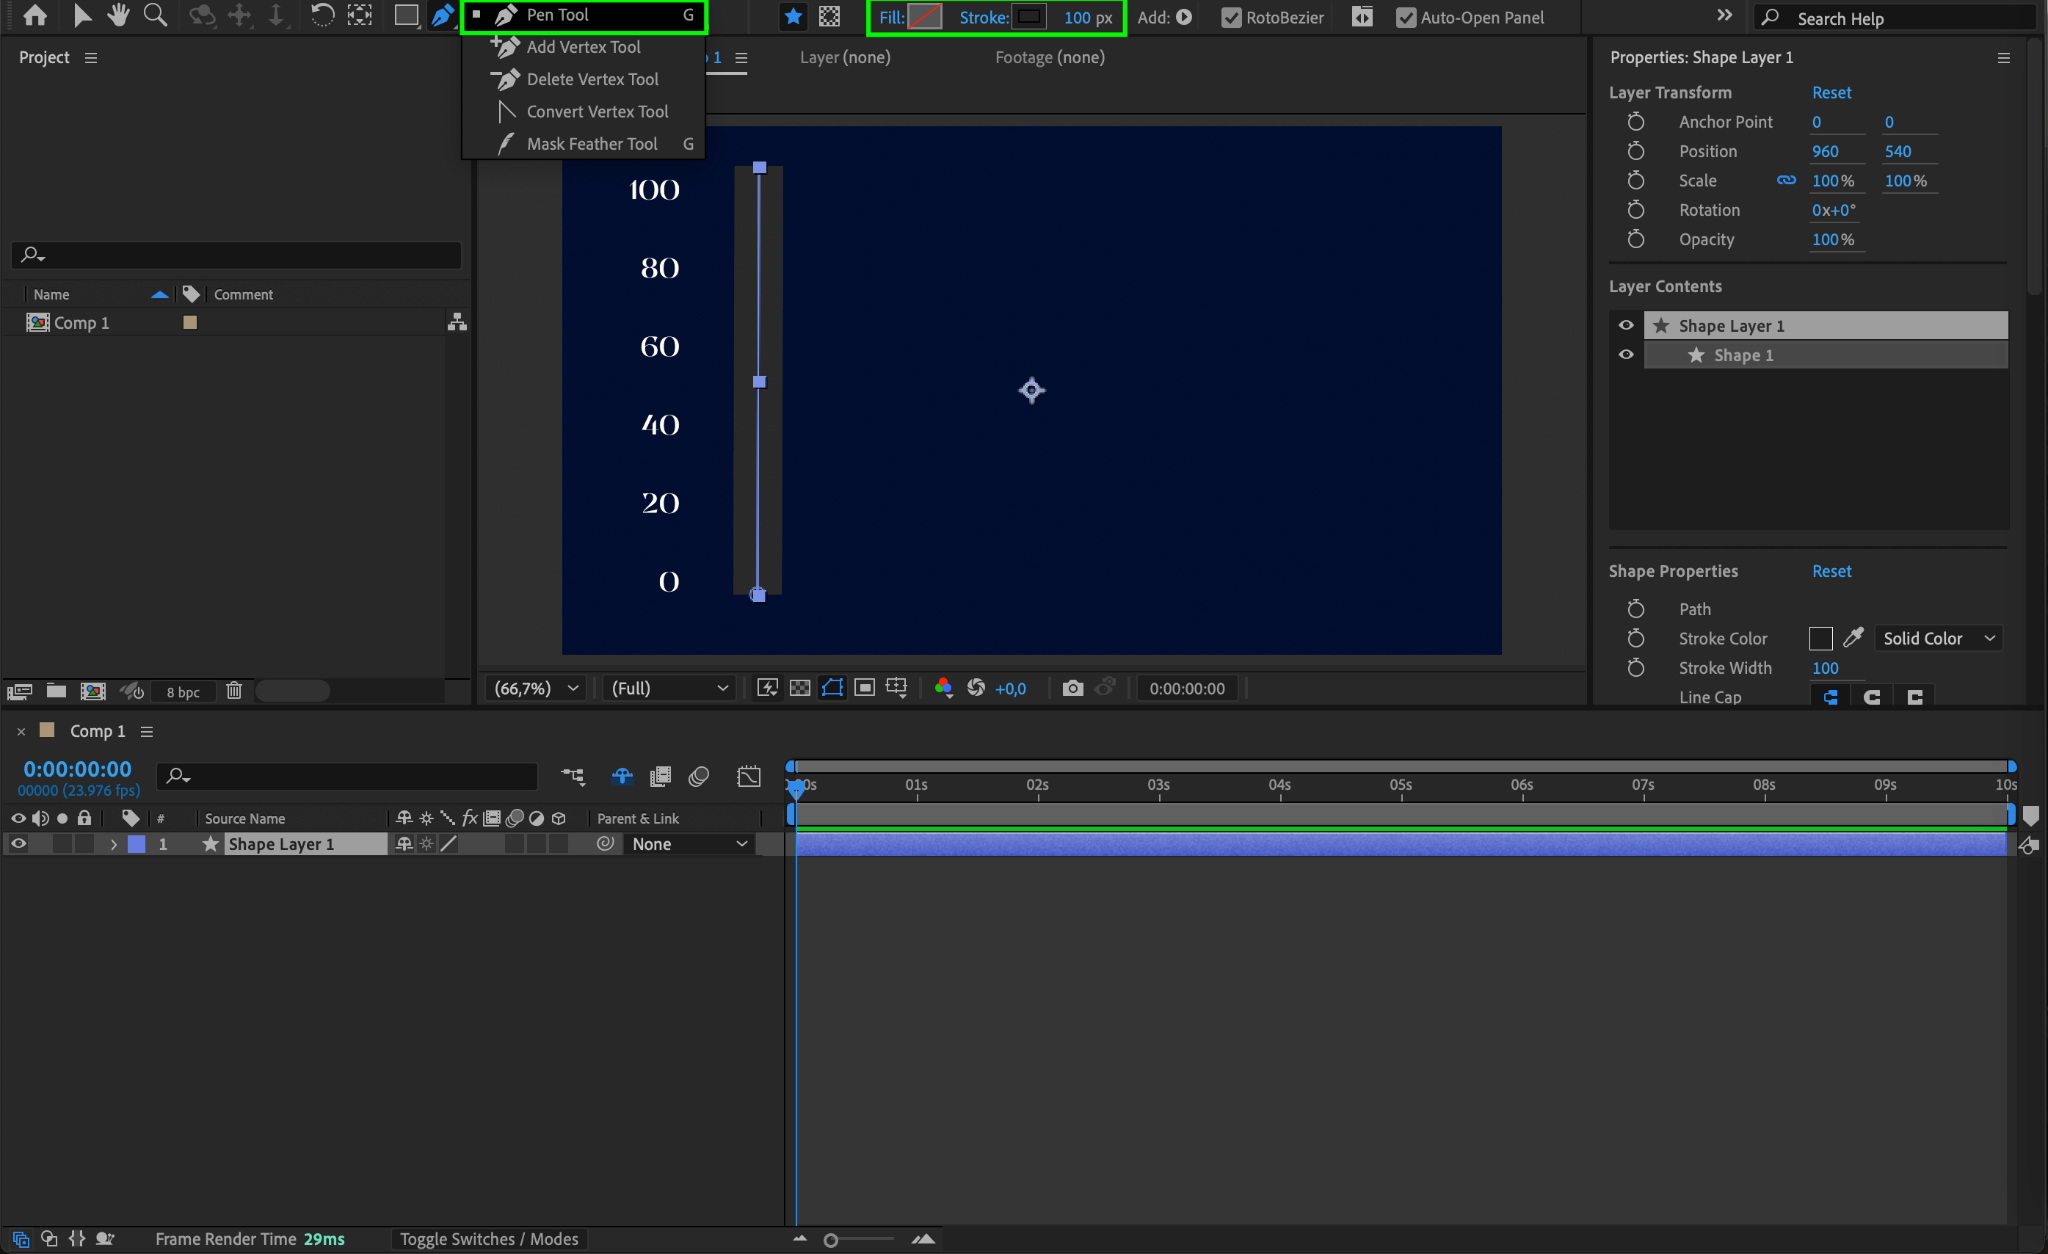
Step 3: Draw the Chart Line
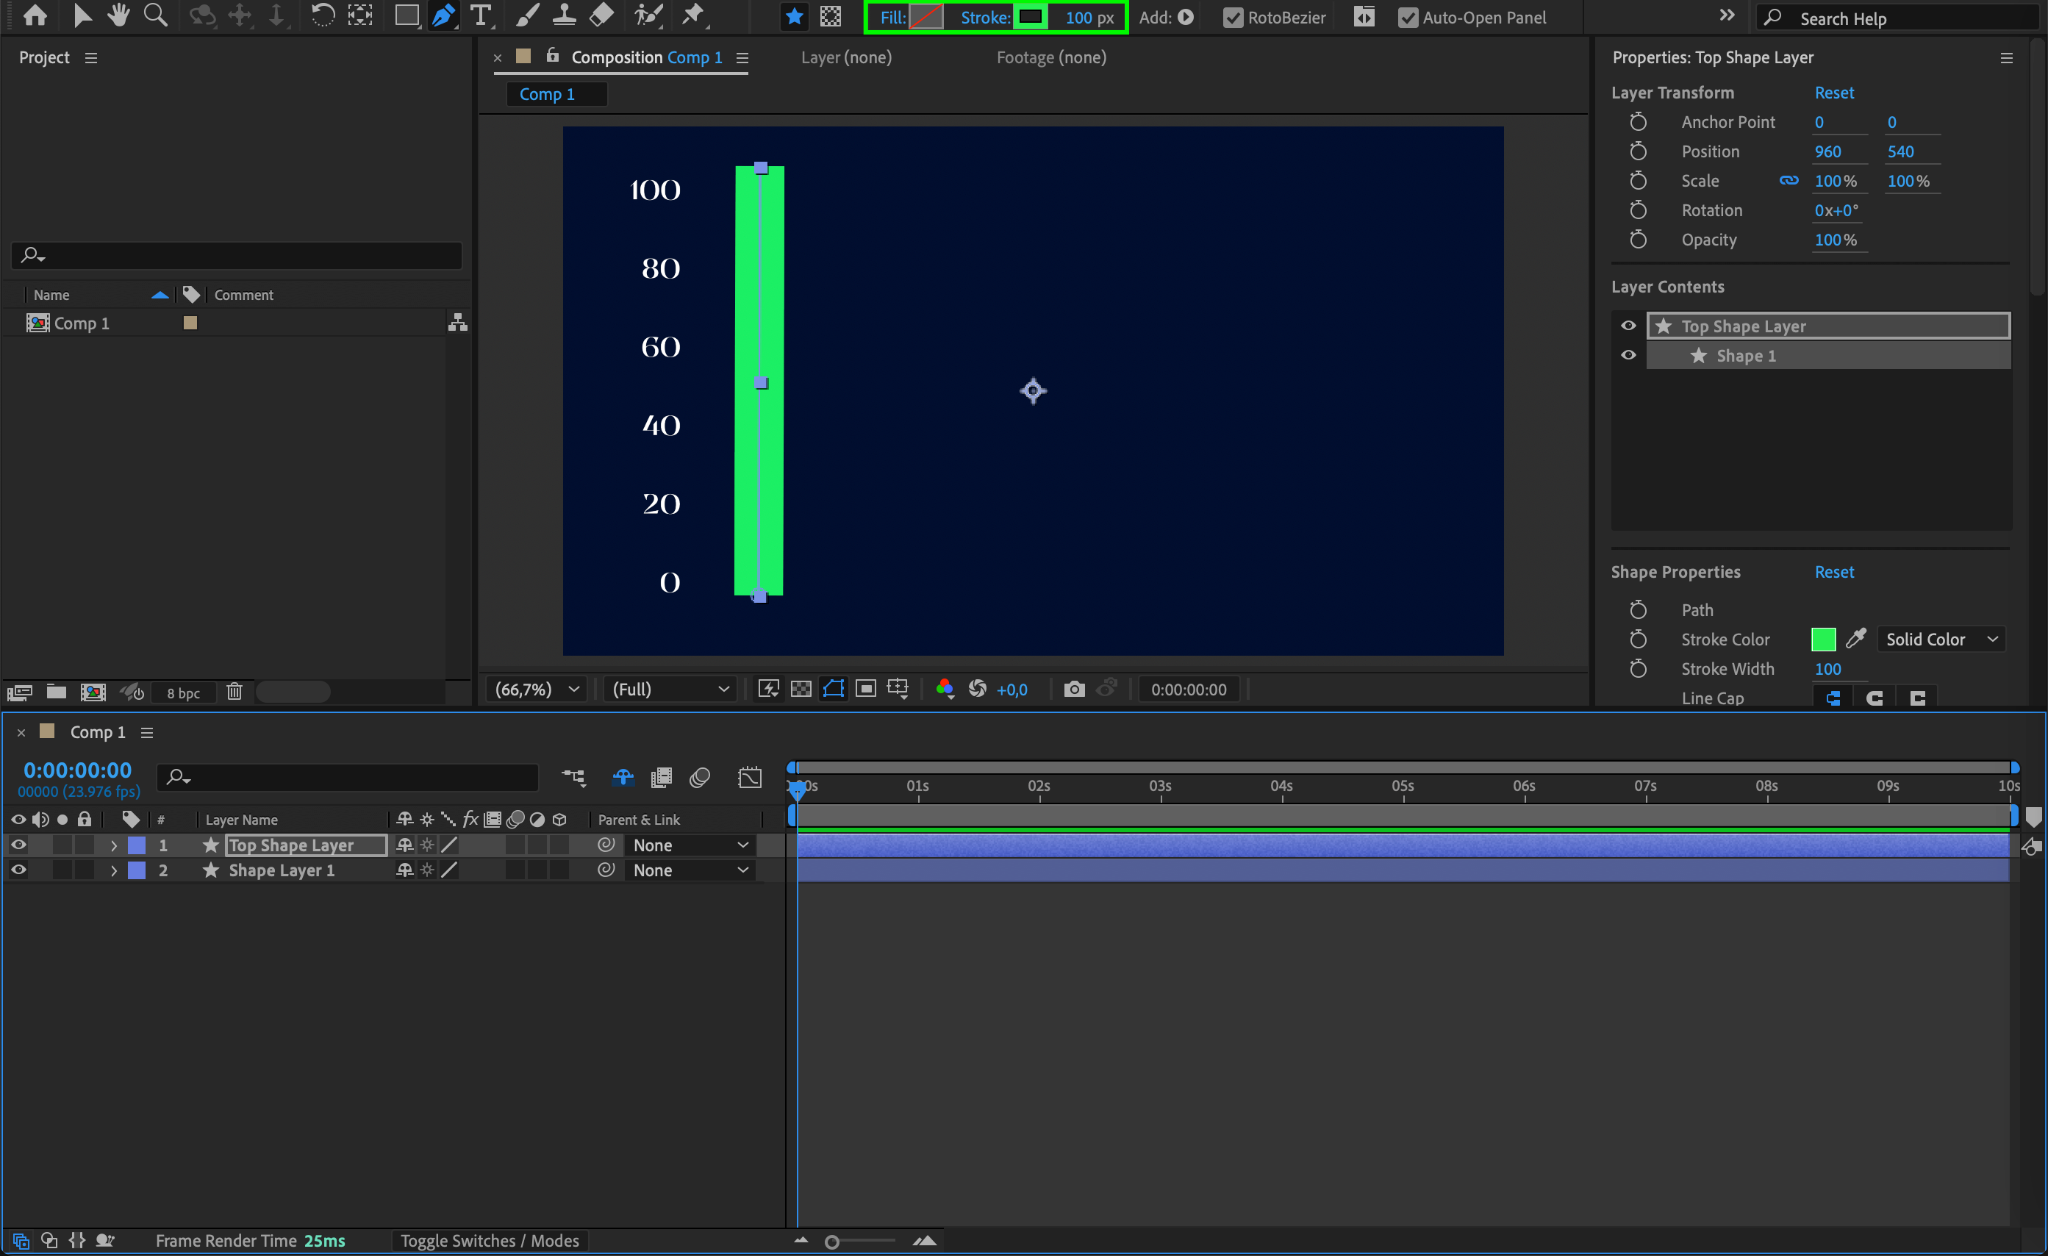
Select the Pen Tool (G) and draw a vertical line for the chart. Set Fill to “None” and choose a gray stroke color with a size of 100 px to make it visible.
Get 10% off when you subscribe to our newsletter

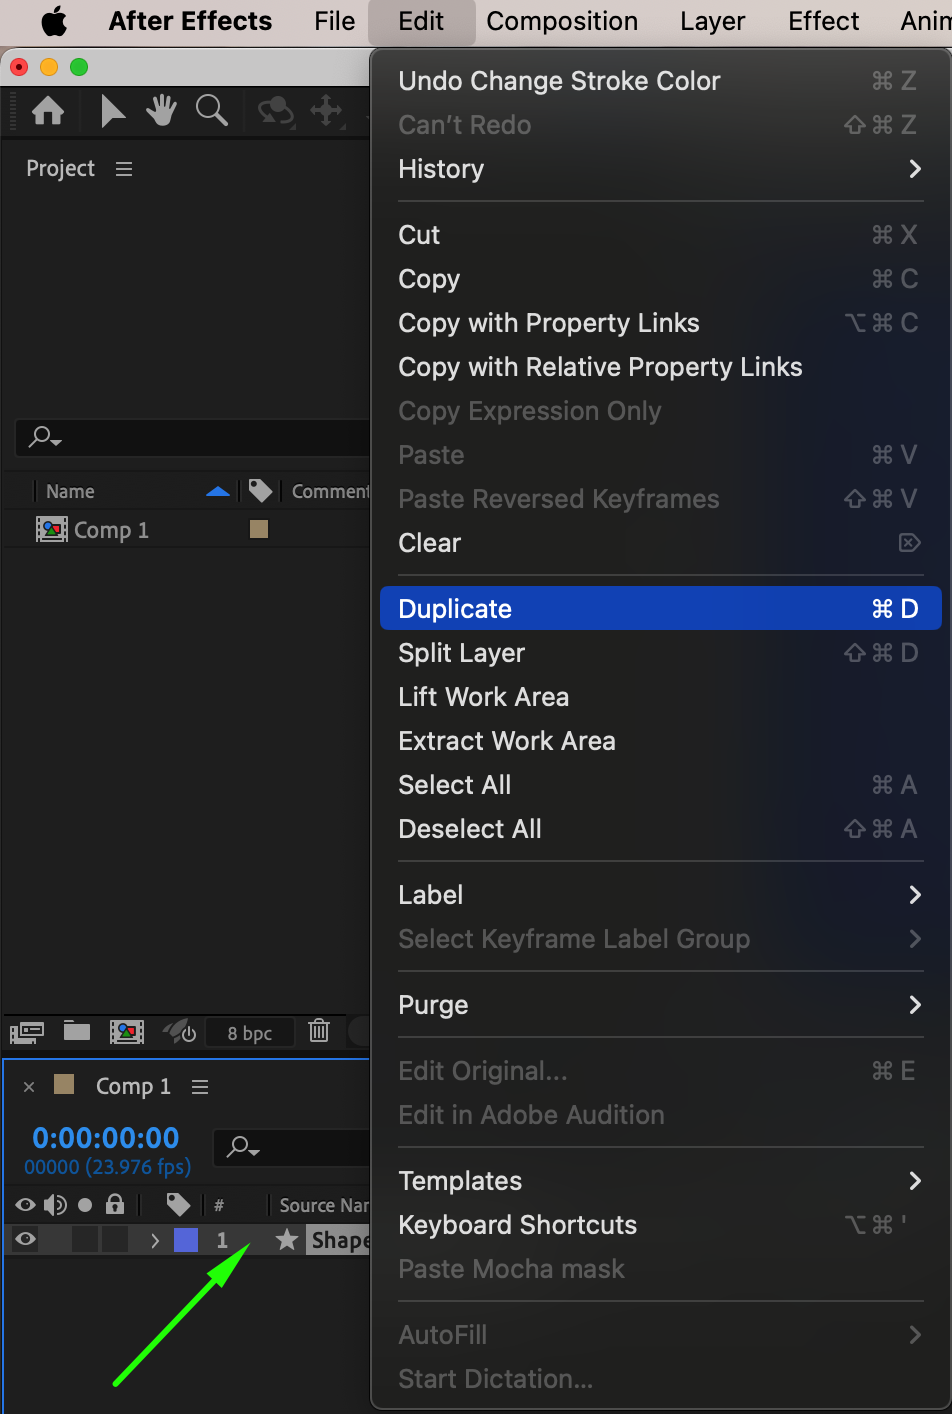
Step 4: Duplicate the Line and Change Color
Go to Edit > Duplicate to create a copy of the line. Change the stroke color of the duplicated line to green. This line will represent the animated progress.
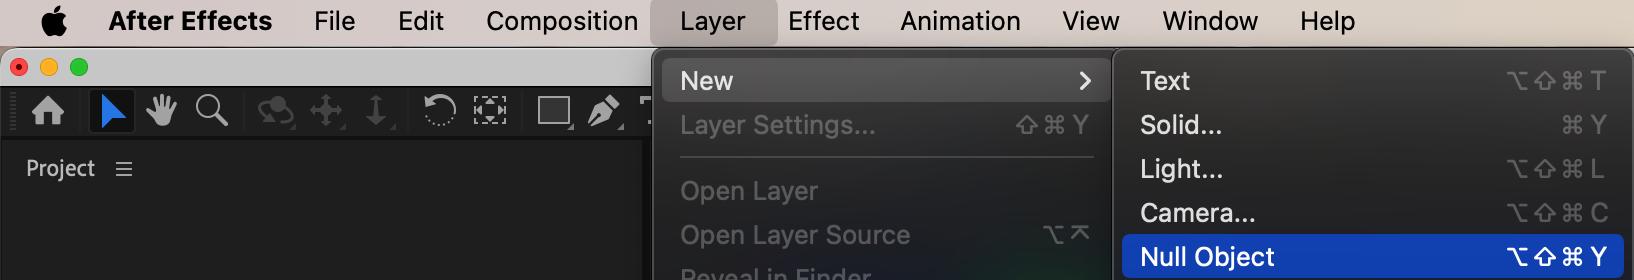
Step 5: Add a Null Object
Go to Layer > New > Null Object to create a null layer. This will control the animation of the chart.
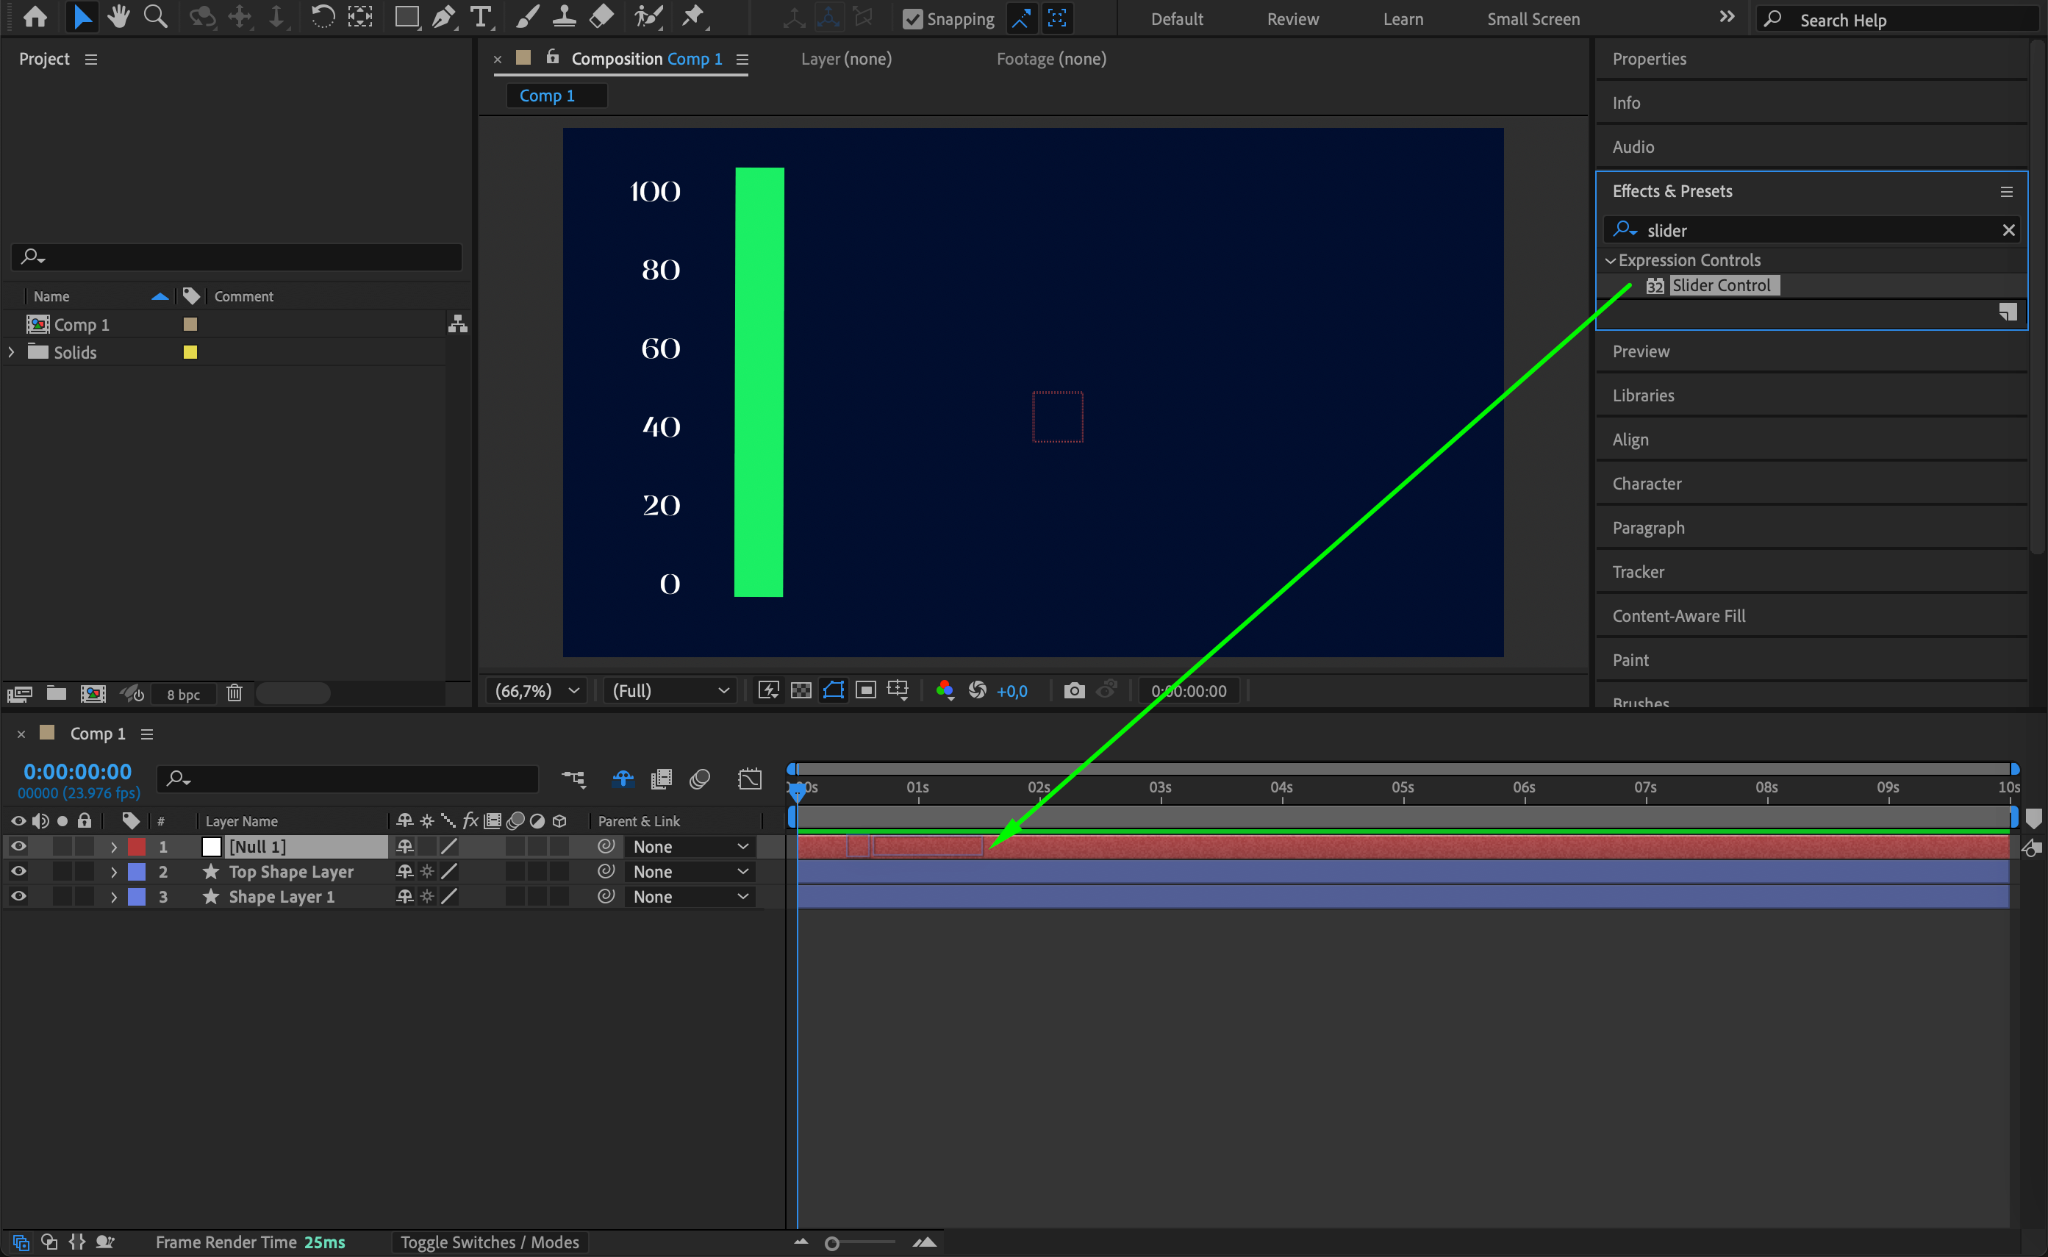
Step 6: Add a Slider Control to the Null Object
With the Null Object selected, go to Effects & Presets and search for Slider Control. Apply it to the null layer. This effect will be used to animate the chart dynamically.
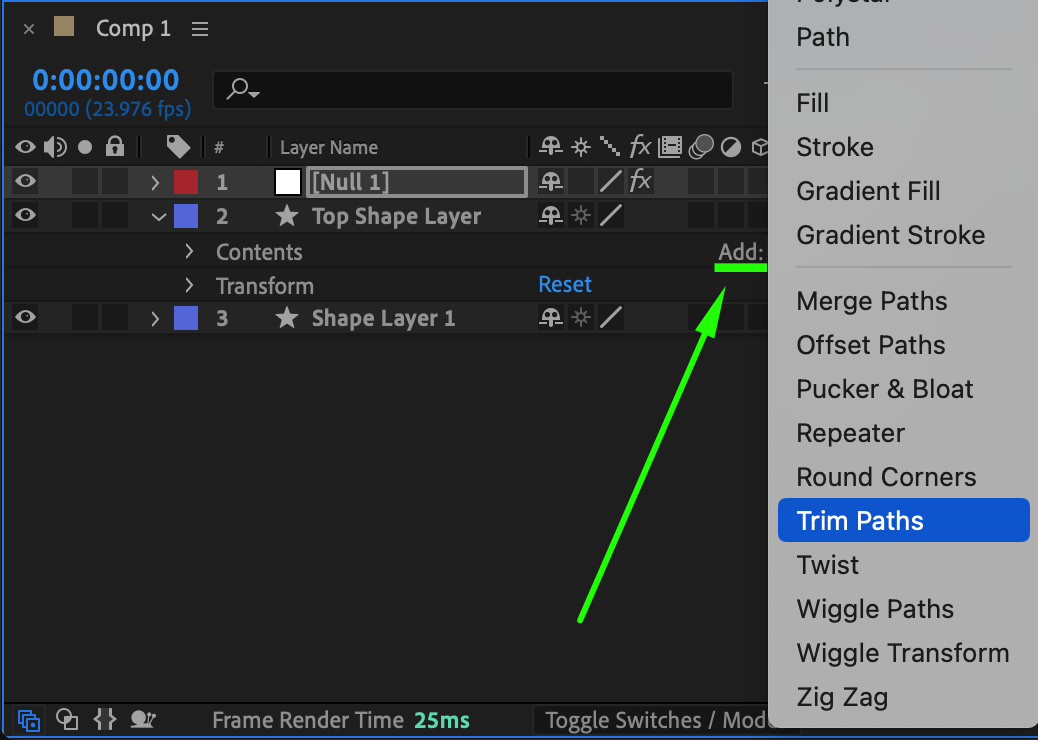
Step 7: Add Trim Paths to the Animated Line
Expand the properties of the duplicated green shape layer. Next to Contents, click the Add button and choose Trim Paths. This will allow you to animate the line drawing effect.
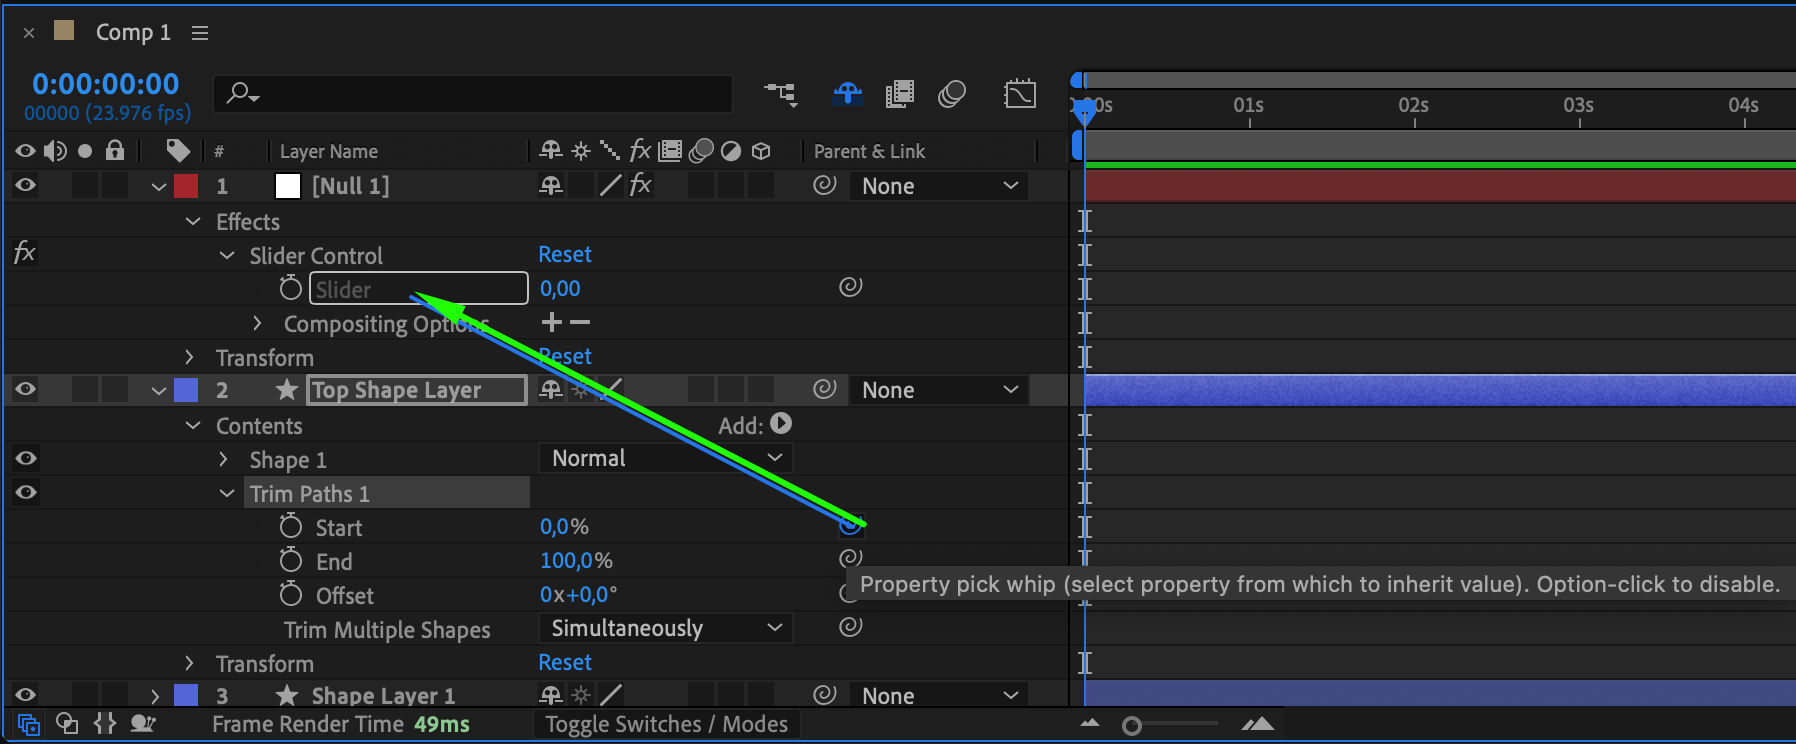
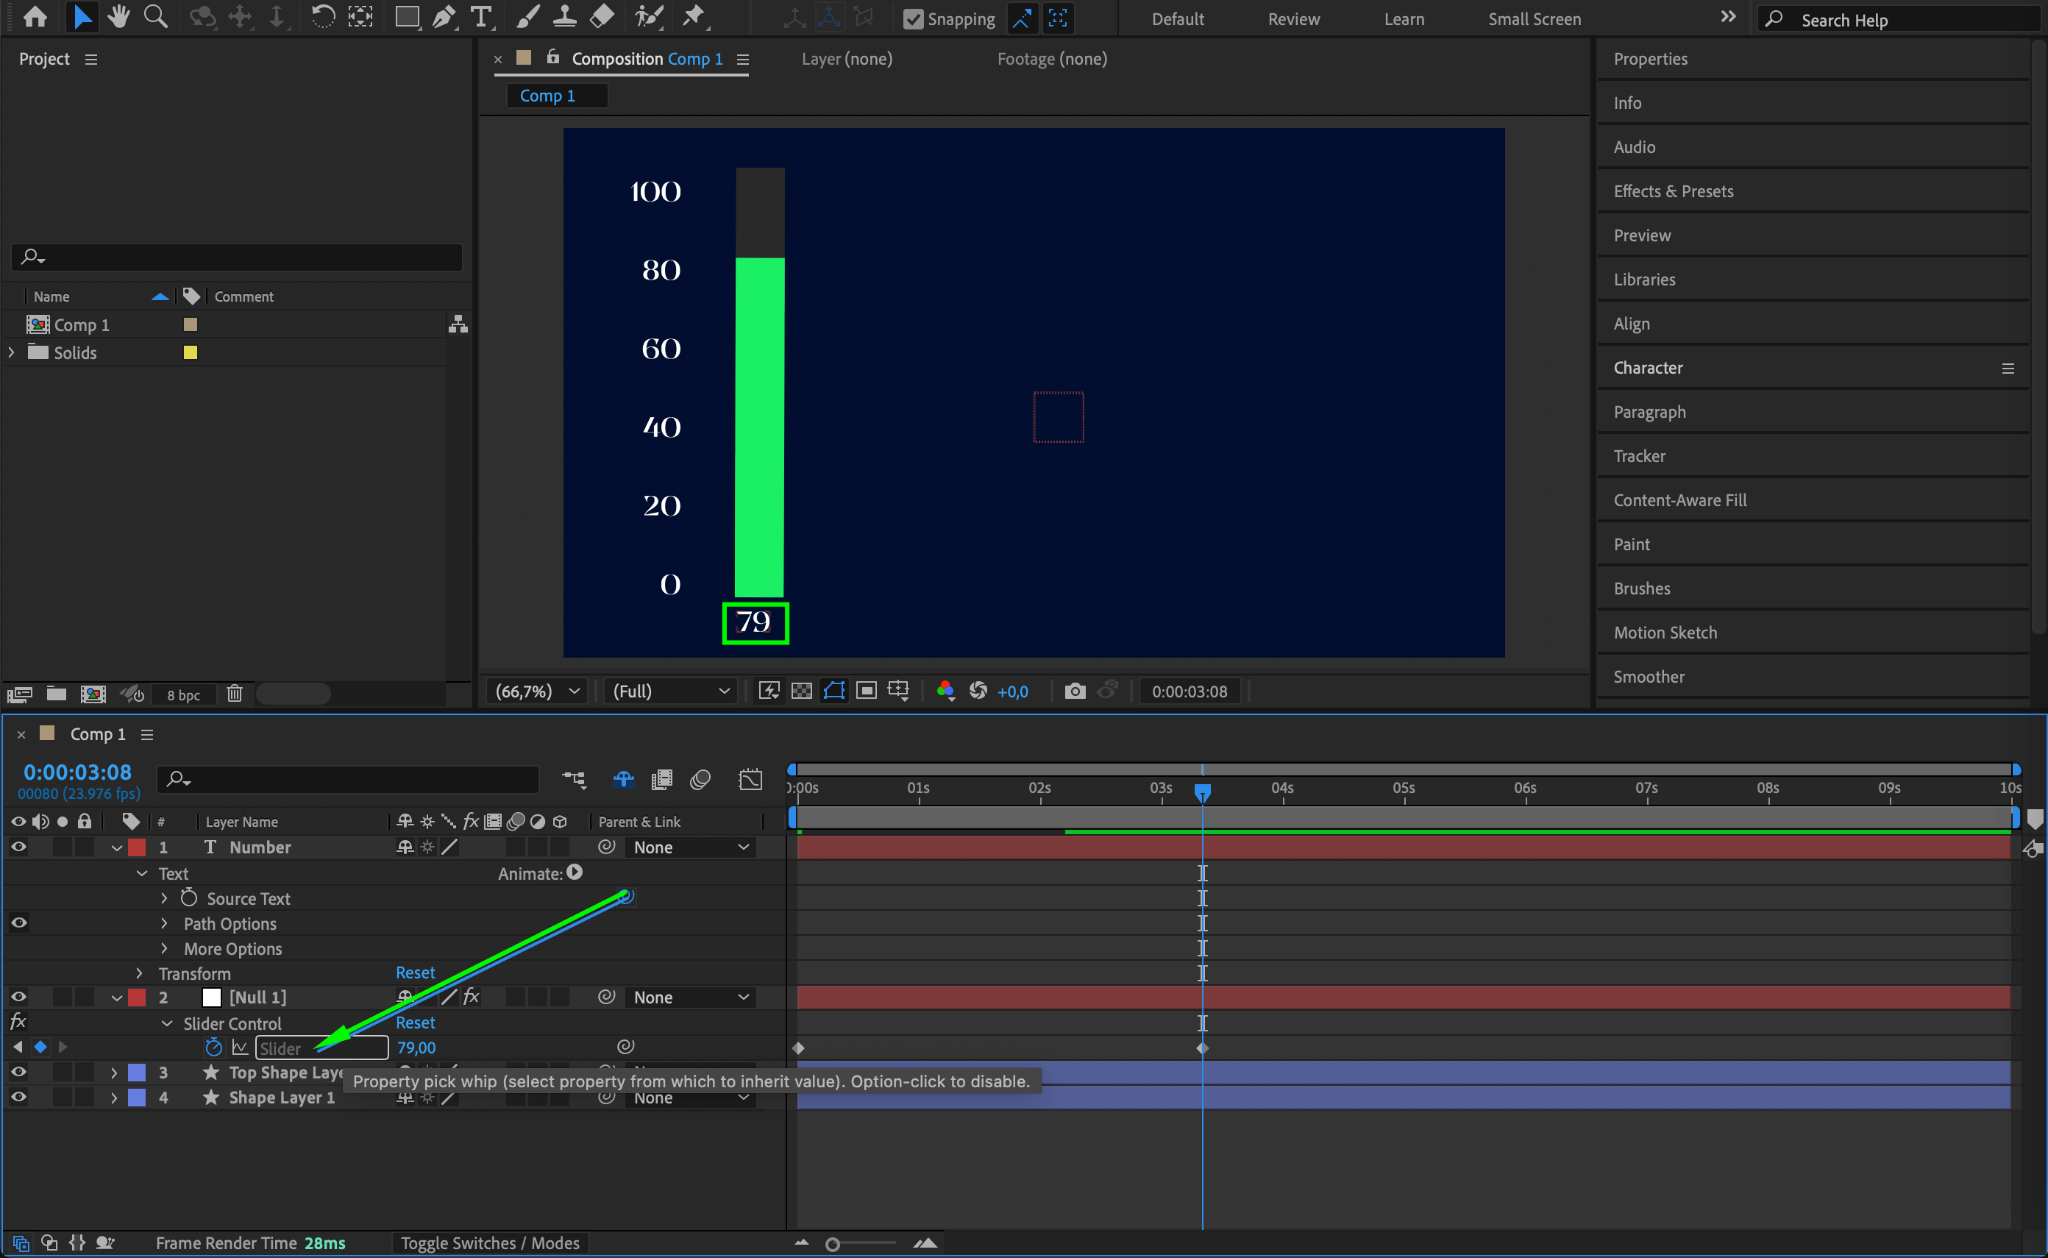
Step 8: Link the Trim Path to the Slider
Select the Start property of the Trim Paths and make it a child of the Slider Control on the null object.
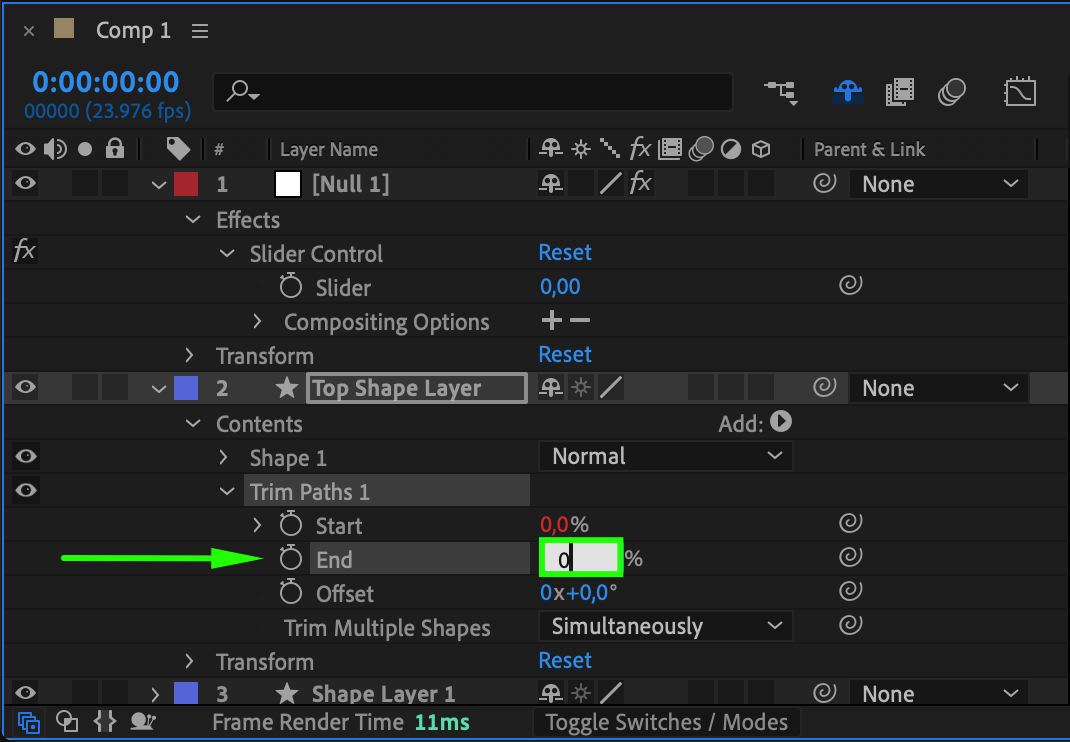
Set the End value to 0.
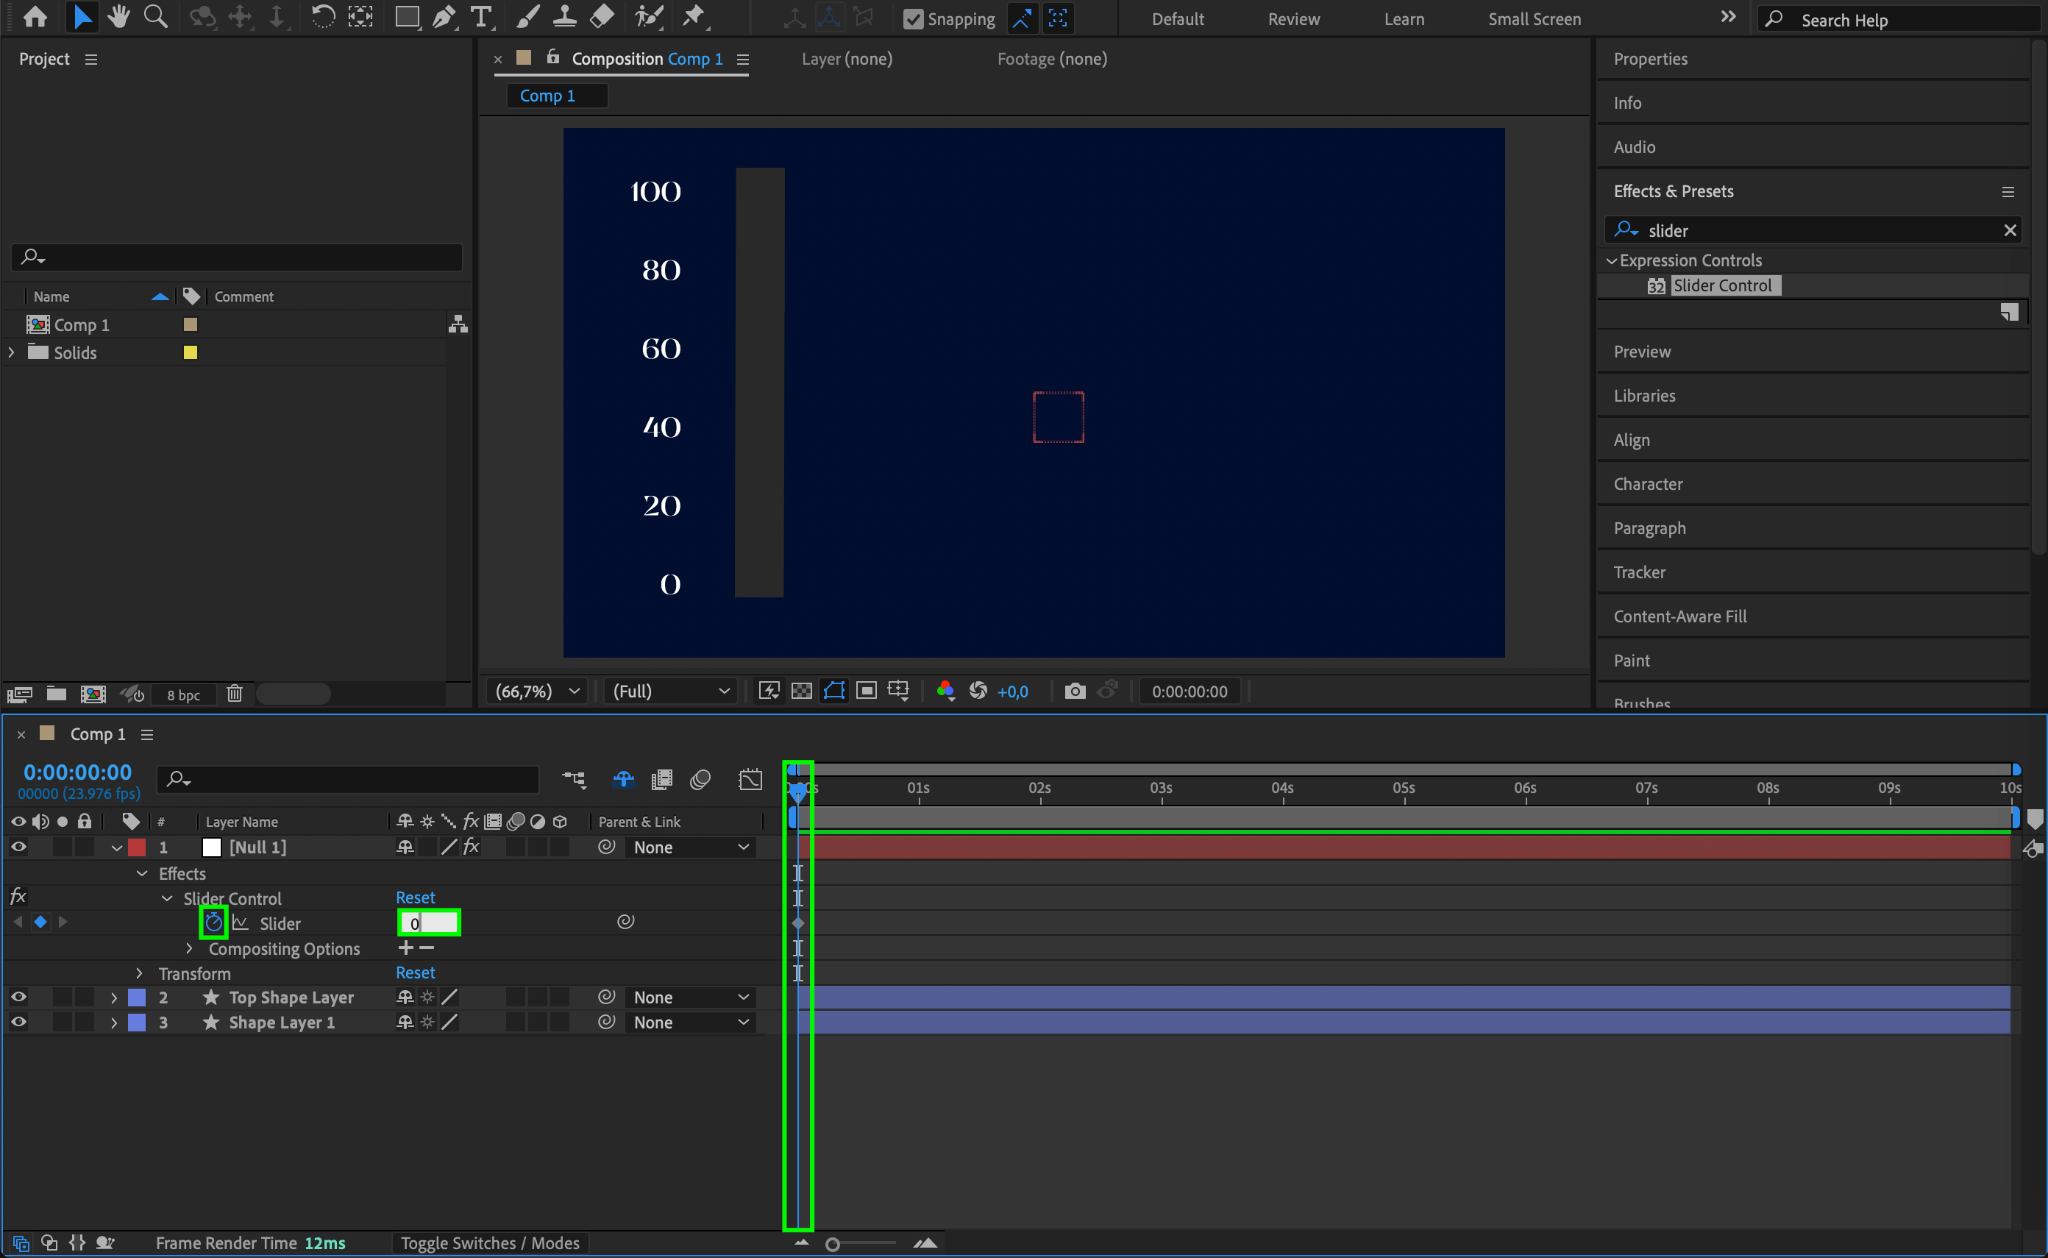
Move the CTI (Current Time Indicator) to the start of the timeline, click the stopwatch icon next to the Slider, and set it to 0.
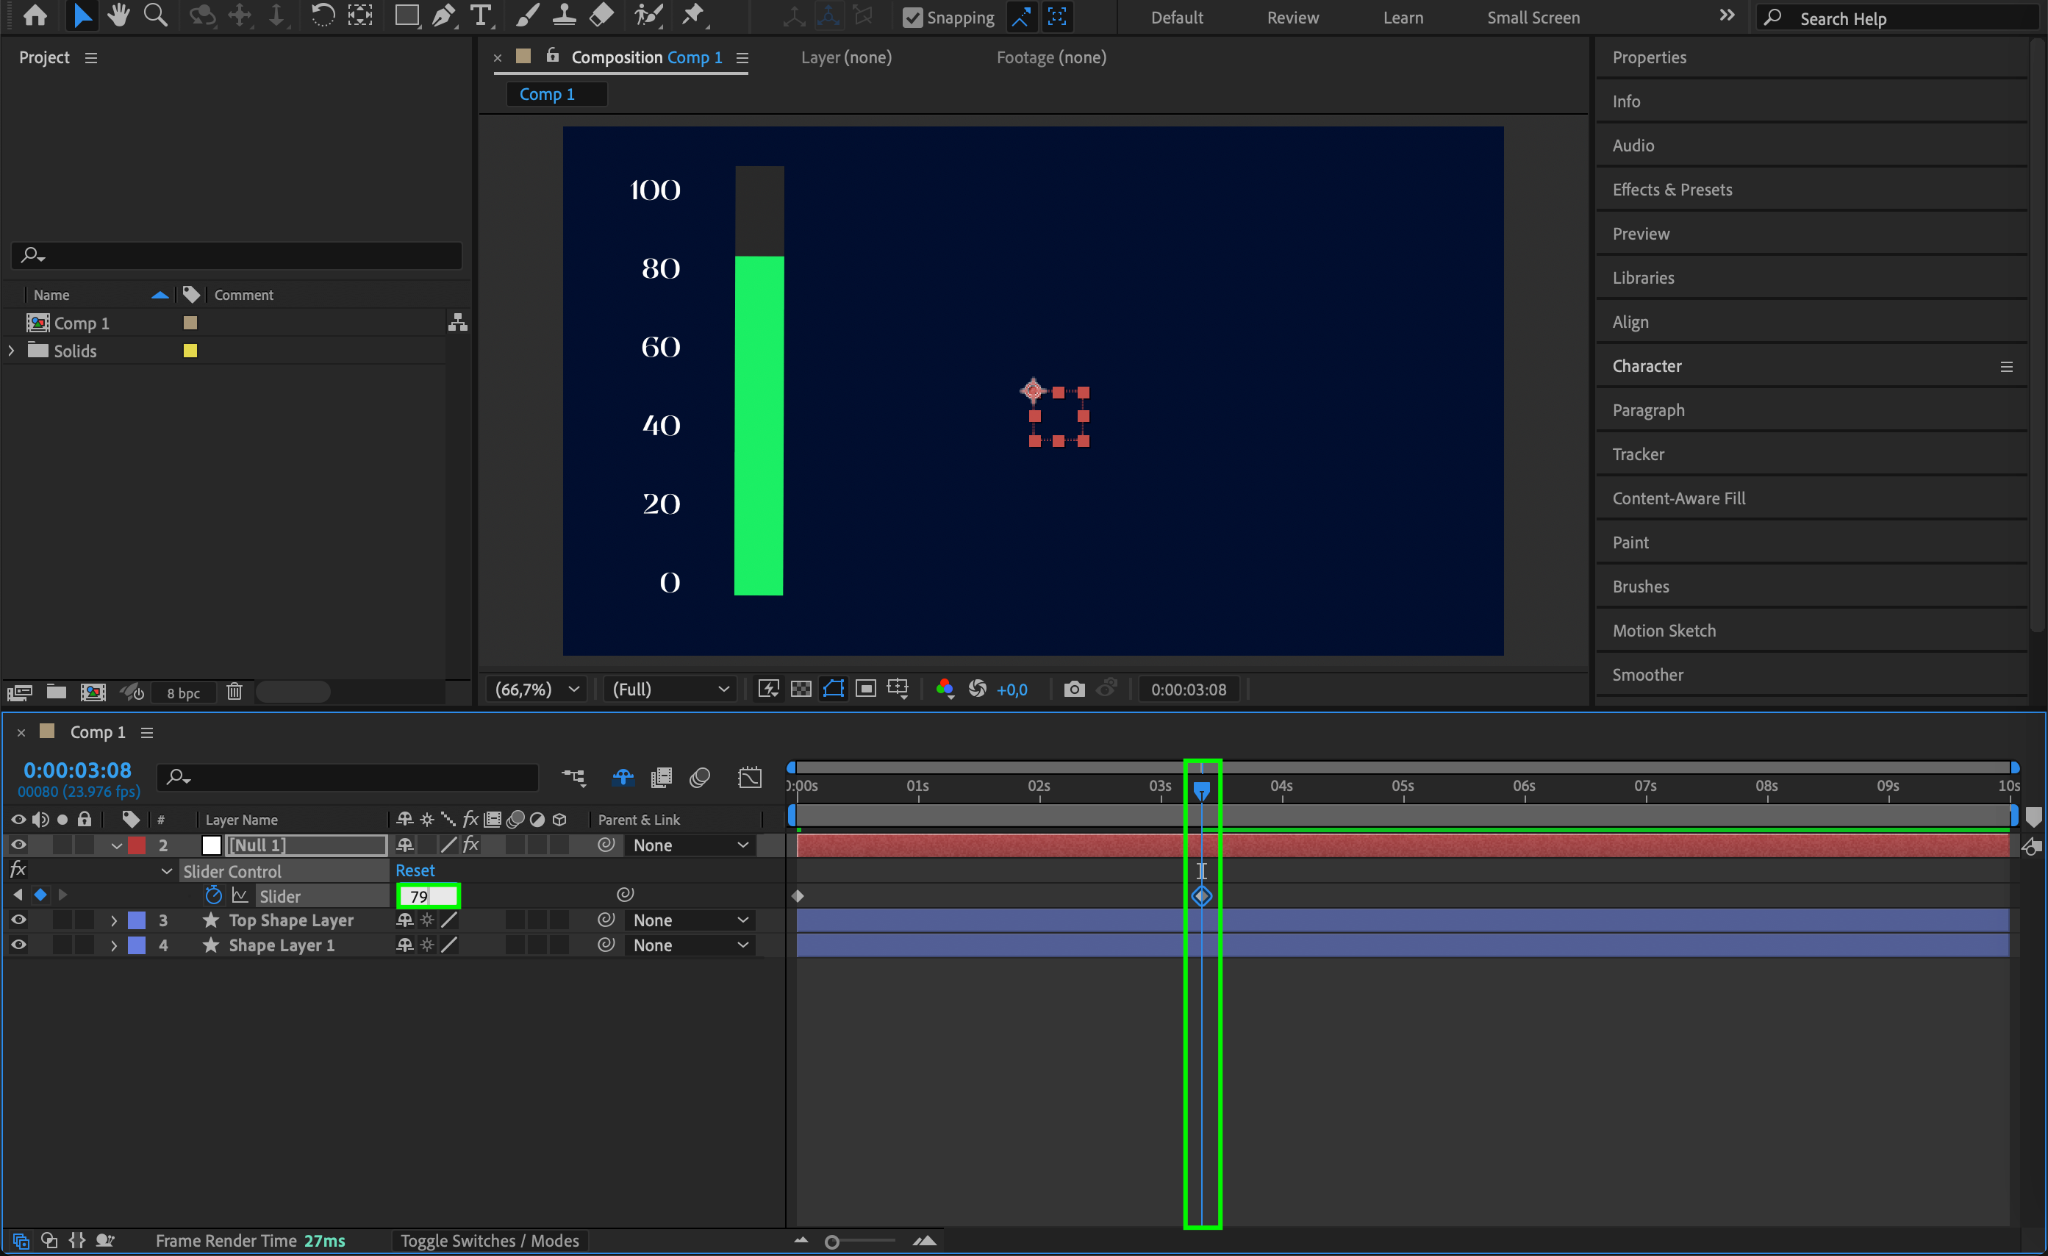
Move the CTI to the middle of the timeline and change the value to 79 (or any value you prefer).
Step 9: Create a Dynamic Percentage Text
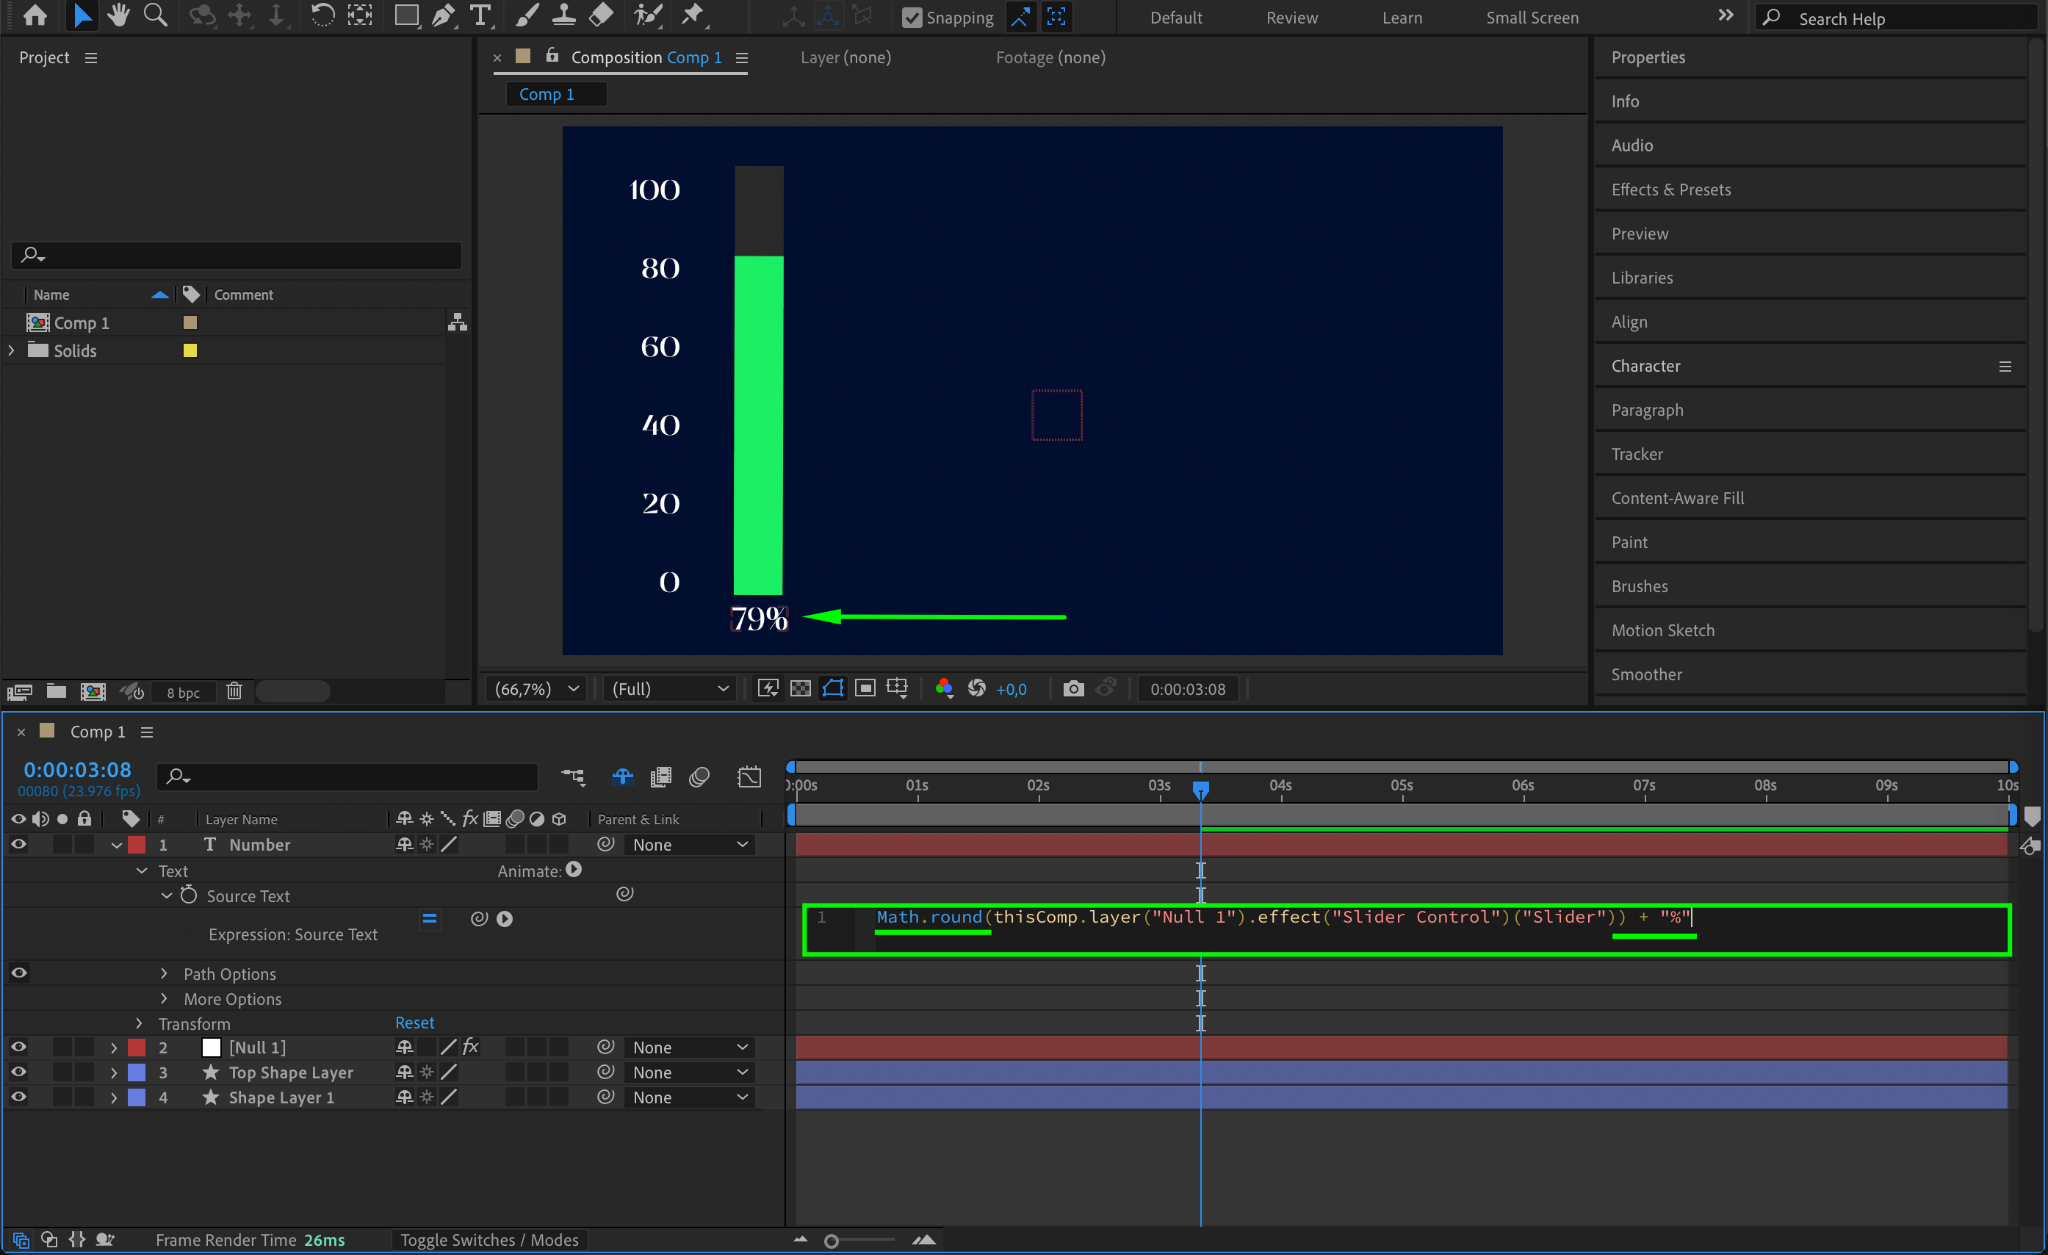
Add a new text layer and type “79” (or your chosen number).
Expand the text properties, find Source Text, and enter the following expression:
Math.round(thisComp.layer(“Null 1”).effect(“Slider Control”)(“Slider”)) + “%”
If you have multiple chart levels, change “Null 1” in the expression to “Null 2”, “Null 3”, etc., for each corresponding level.
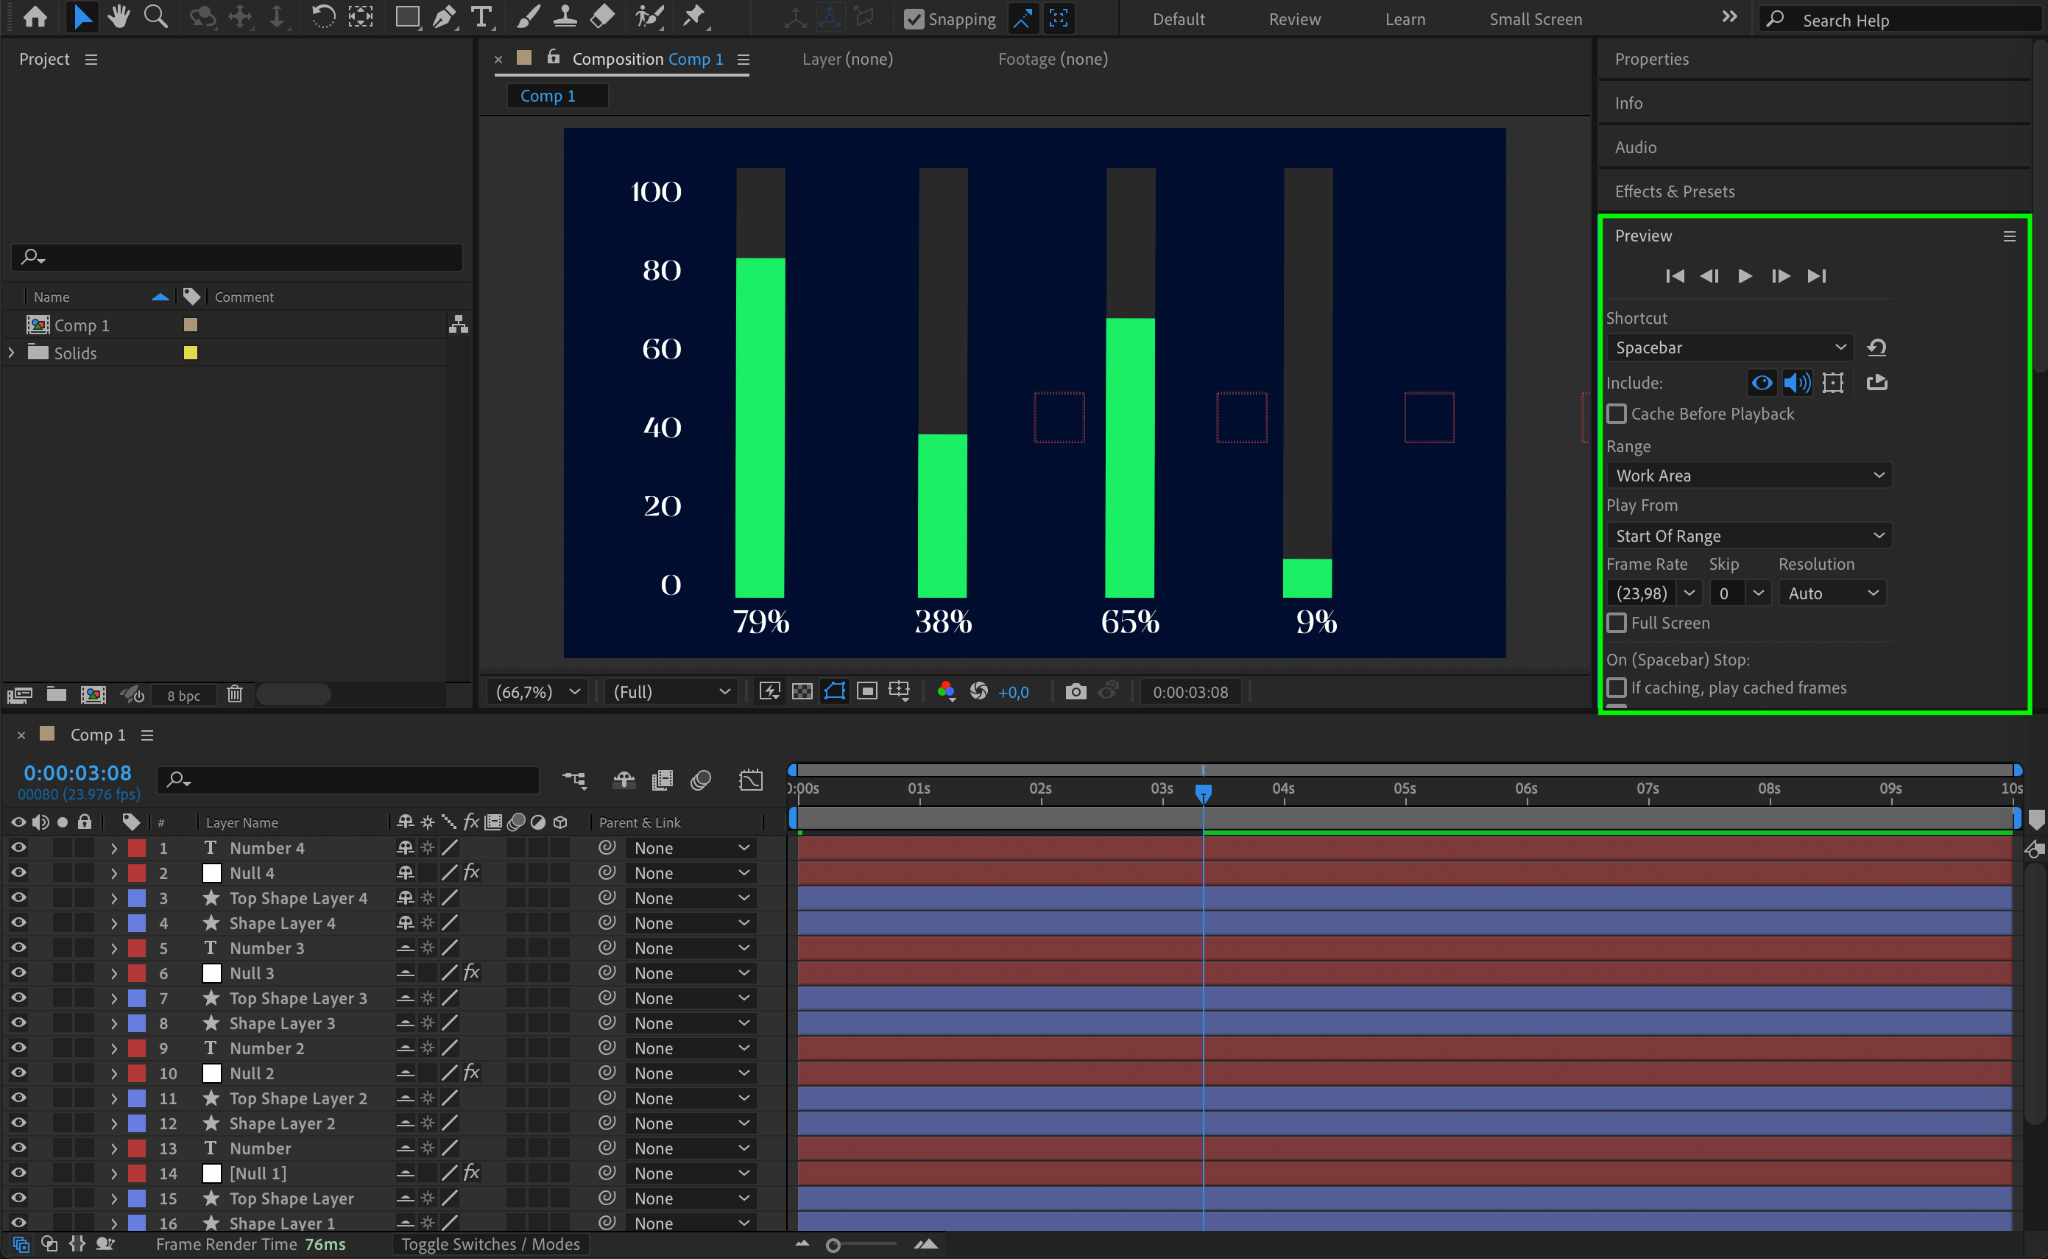
Step 10: Repeat the Process for Each Chart Column
Repeat steps 4-9 for each additional chart column you want to animate. Ensure that you set up the correct parent-child relationships between the layers.
Step 11: Preview the Animation
Press Spacebar to preview the animation and check if everything moves as expected. Adjust keyframes and timing as needed.
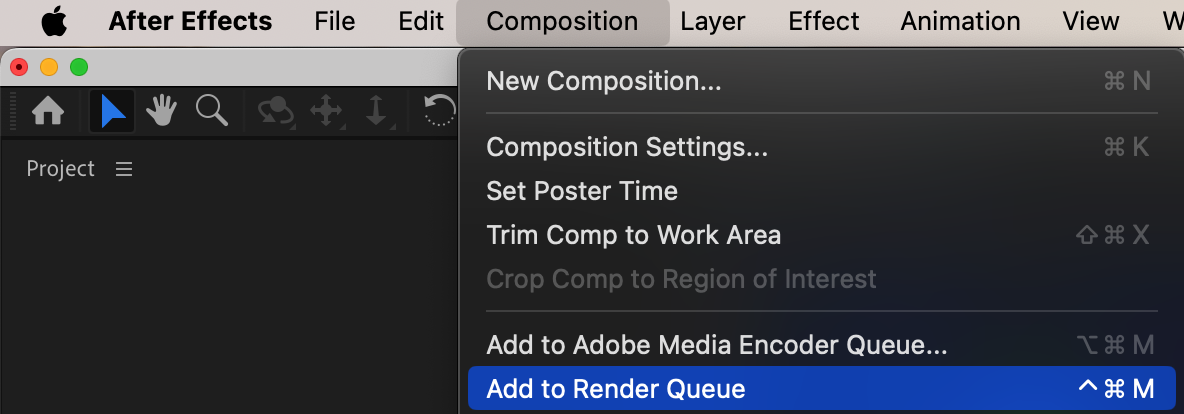
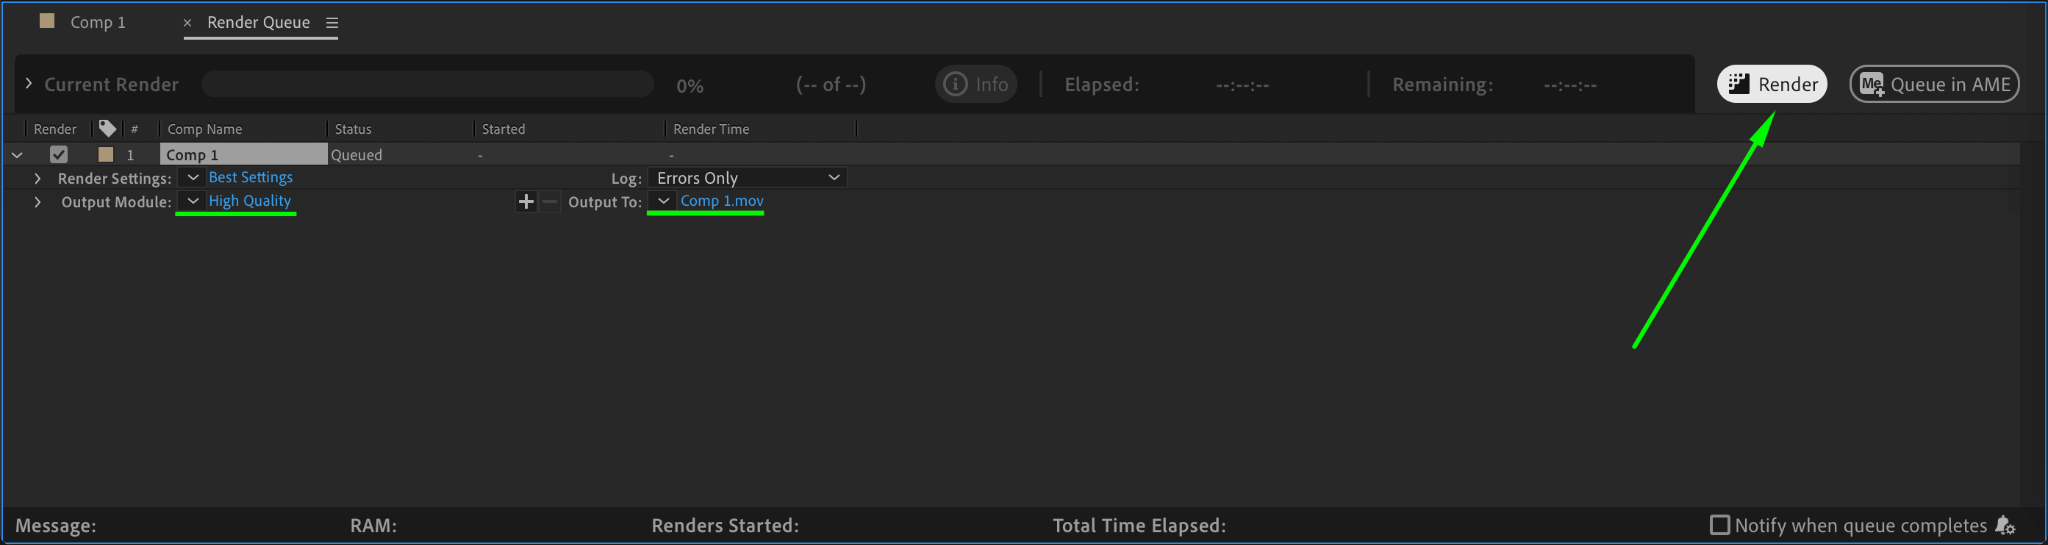
Step 12: Render the Final Animation
Once satisfied with the animation, go to Composition > Add to Render Queue and render your final video with the desired settings.
Conclusion
You have successfully created an animated flow chart in After Effects! By using shape layers, trim paths, expressions, and slider controls, you can create dynamic and professional data visualizations. Experiment with different animations and effects to make your chart even more engaging.
Our Bestsellers


