Creating Animated Graphs in After Effects: A Step-by-Step Guide
Introduction
Are you tired of boring and static graphs? Want to create engaging and dynamic animated graphs for your videos or presentations? Look no further! In this guide, we will walk you through the step-by-step process of making an animated graph using Adobe After Effects.
Step-by-Step Guide: Making an Animated Graph in After Effects
Get 10% off when you subscribe to our newsletter

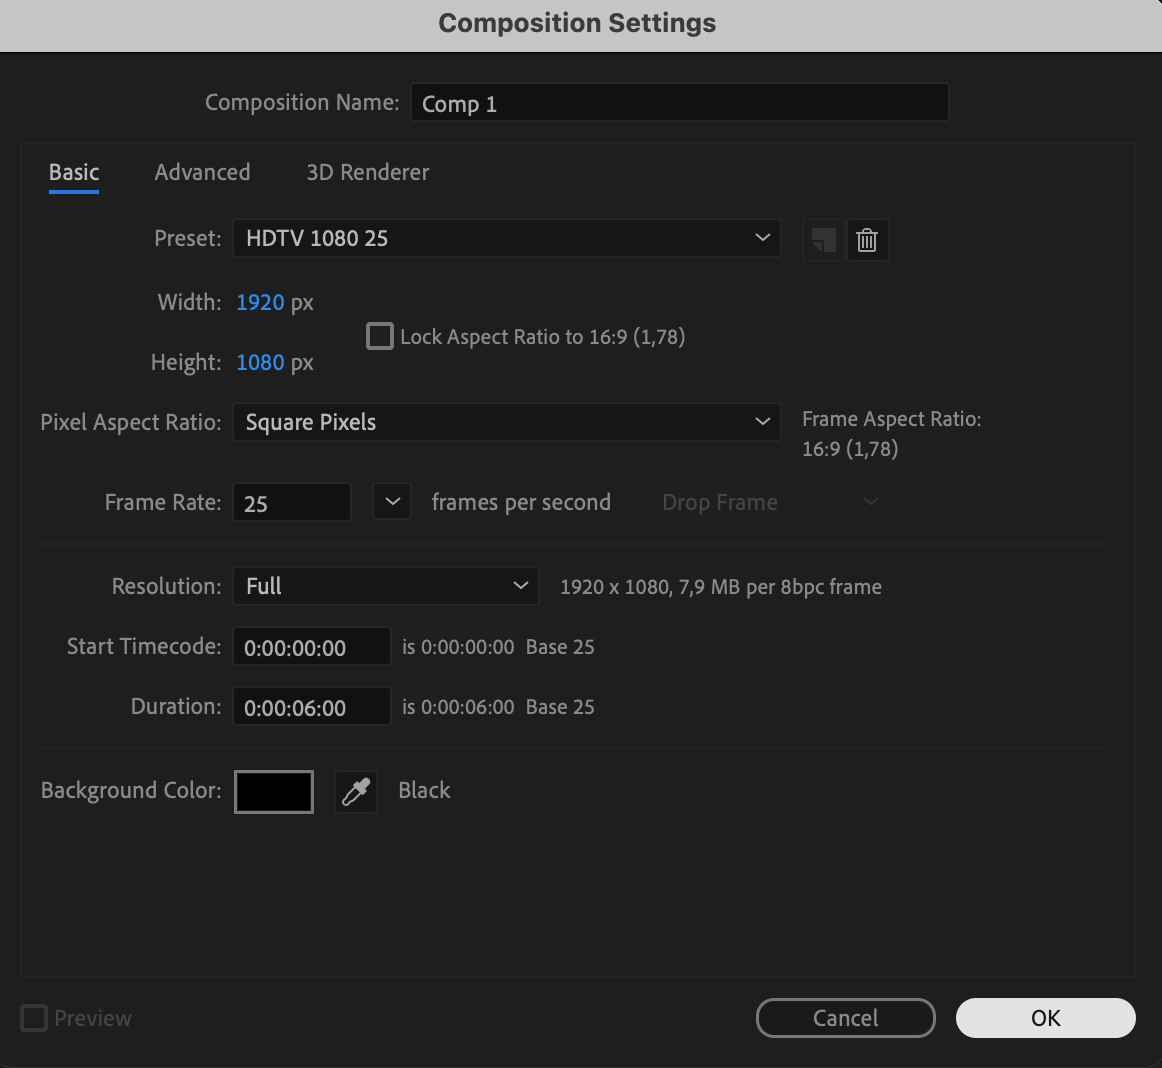
Step 1: Create a New Composition
Open After Effects and create a new composition by navigating to Composition > New Composition. Set the parameters such as resolution, frame rate, and duration to match your project requirements.
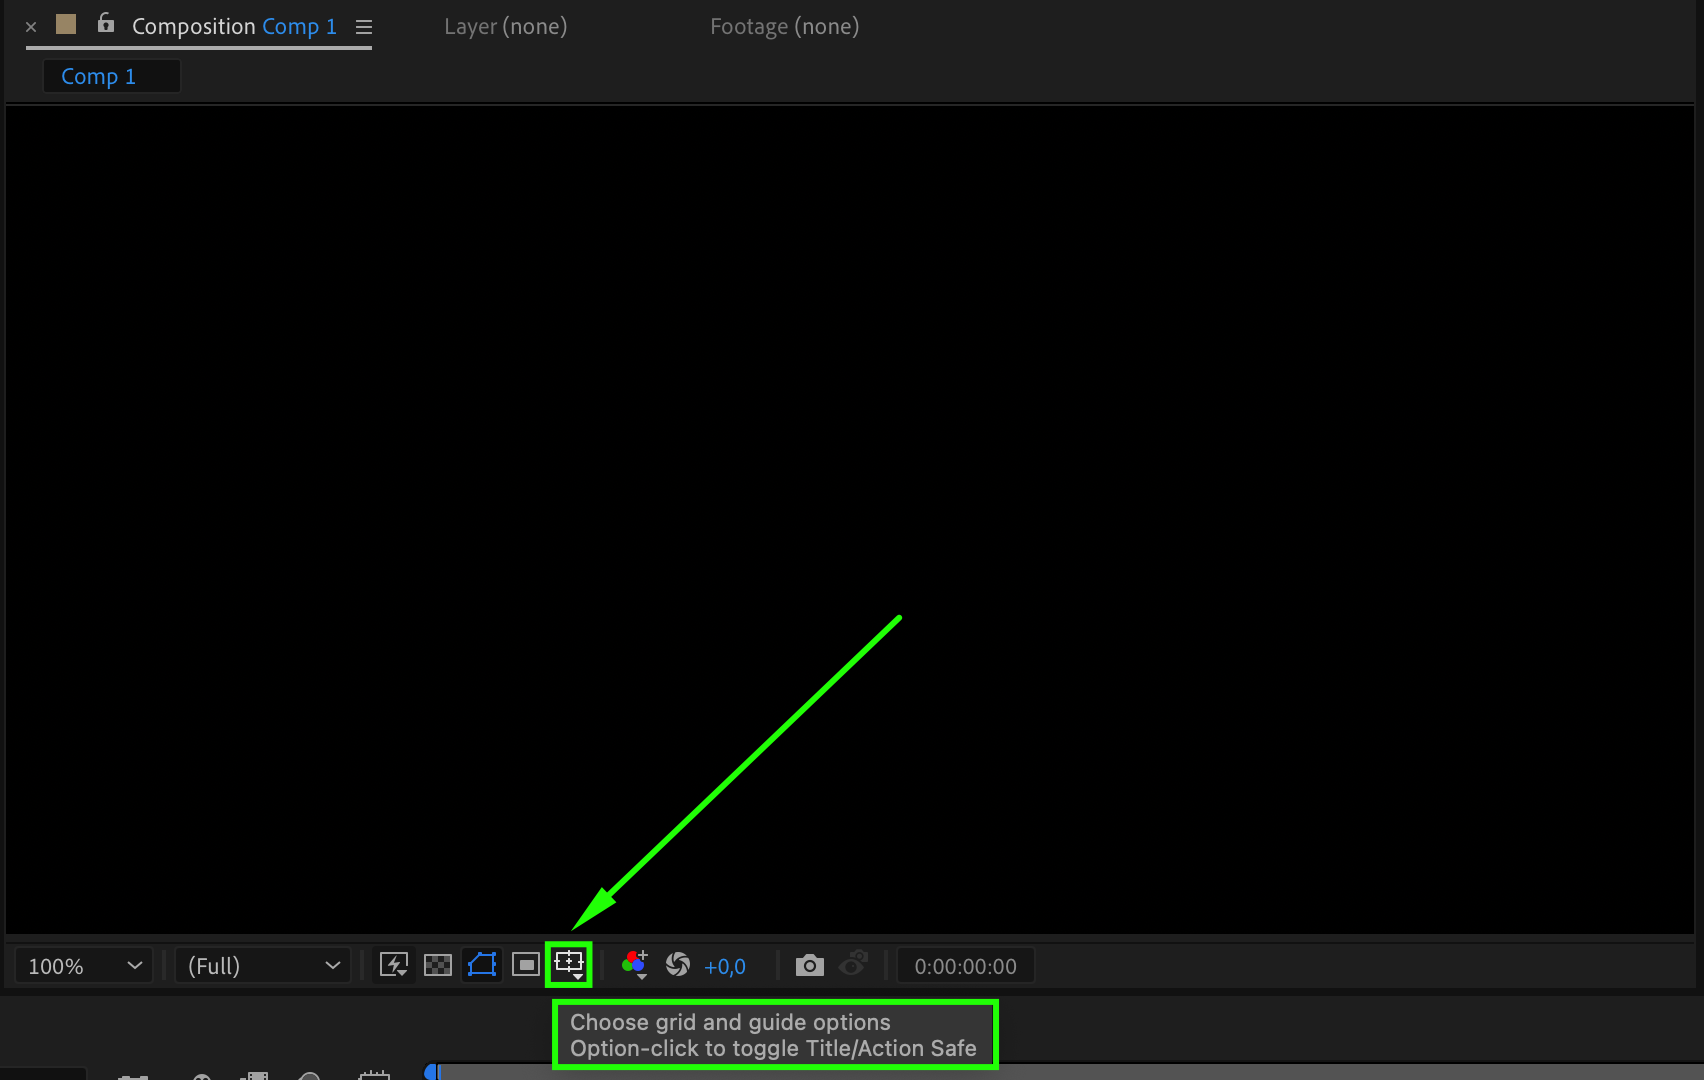
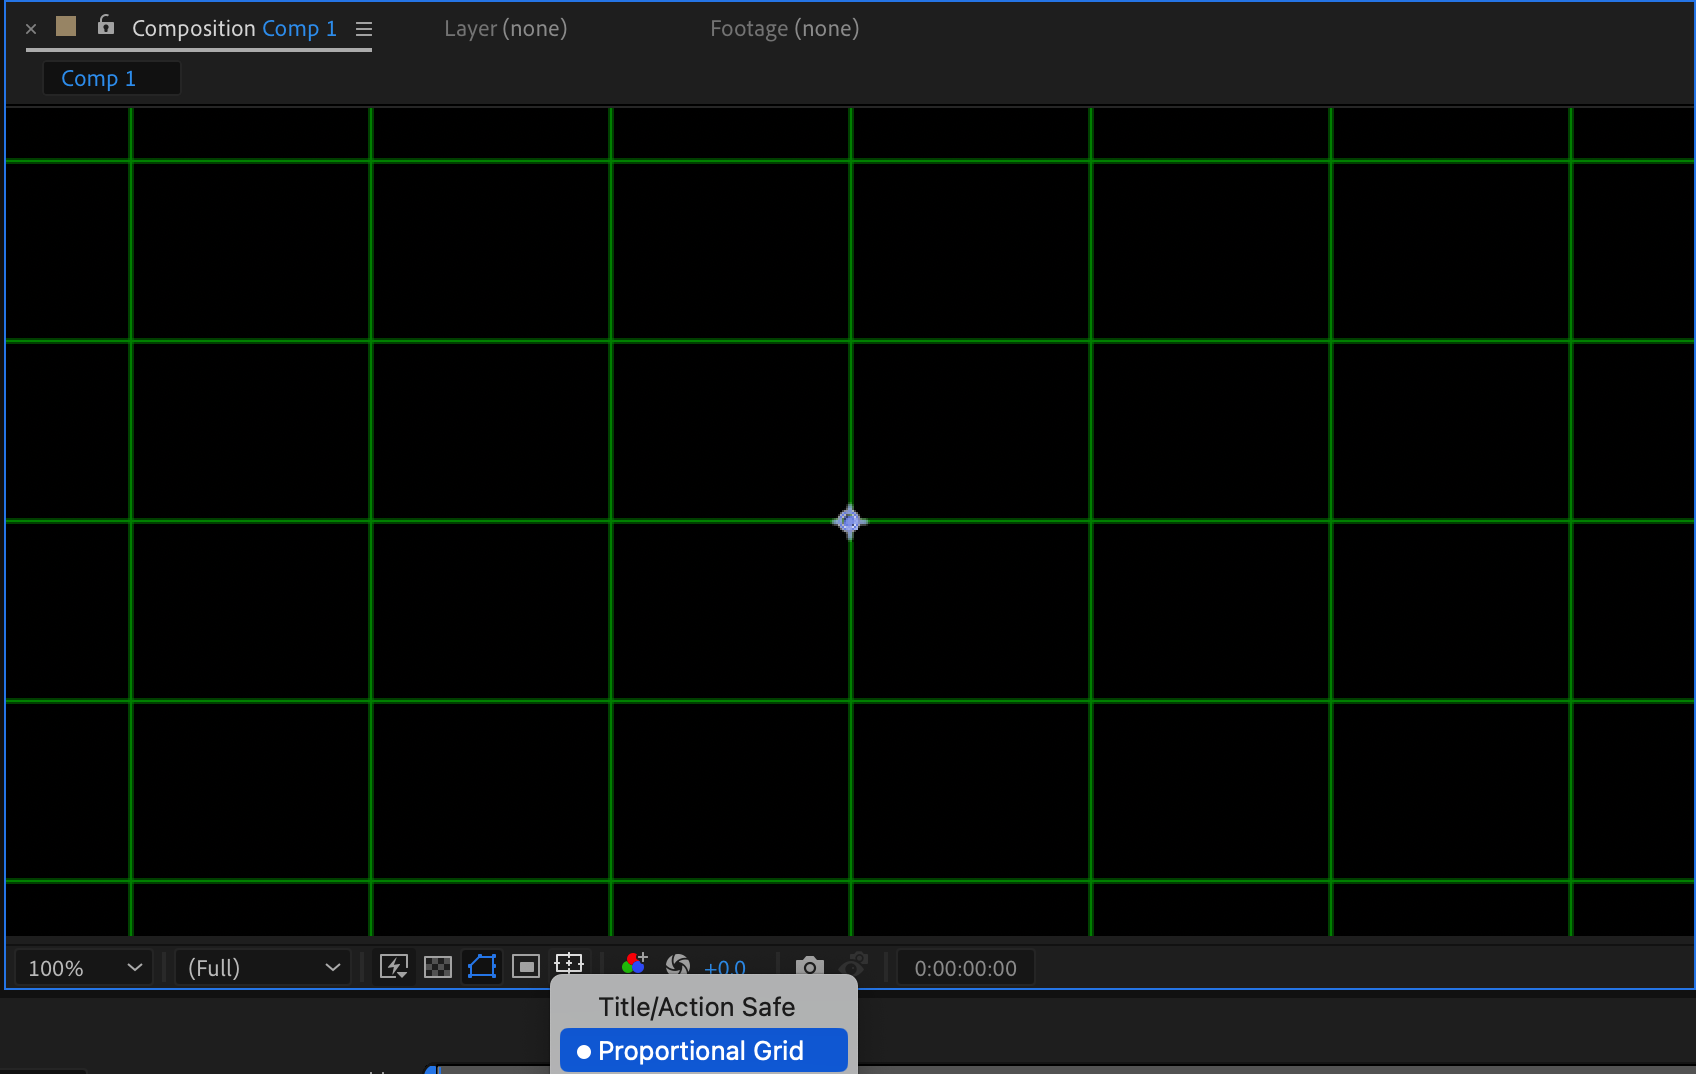
 Step 2: Enable Proportional Grid
At the bottom of the composition panel, click the Proportional Grid button to enable grid lines. This will help you align all the elements you create for your graph accurately.
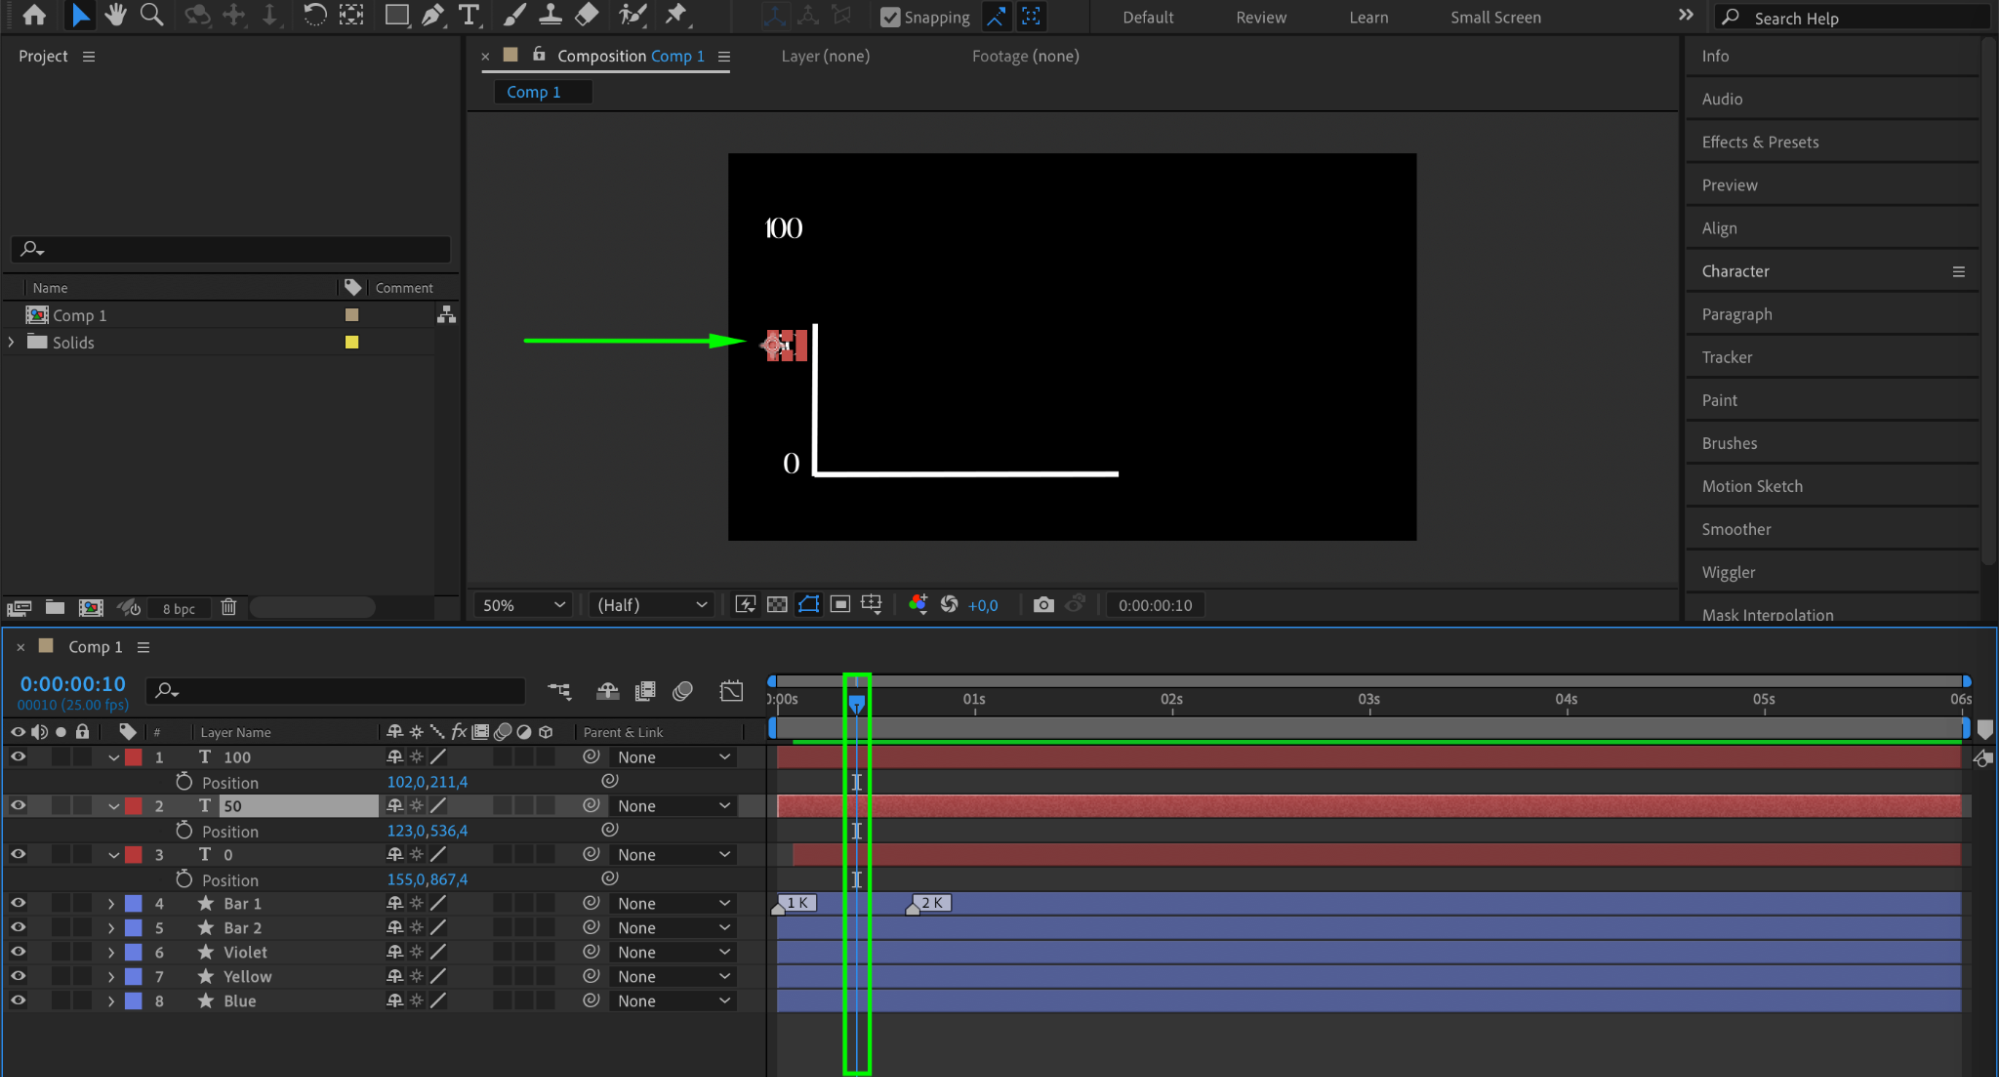
 Step 3: Draw Bars Using the Pen Tool
Use the Pen Tool (G) to draw Bar 1 and Bar 2 separately, ensuring each can be animated independently. Above the composition panel, customize the stroke color and pixel width to suit your design.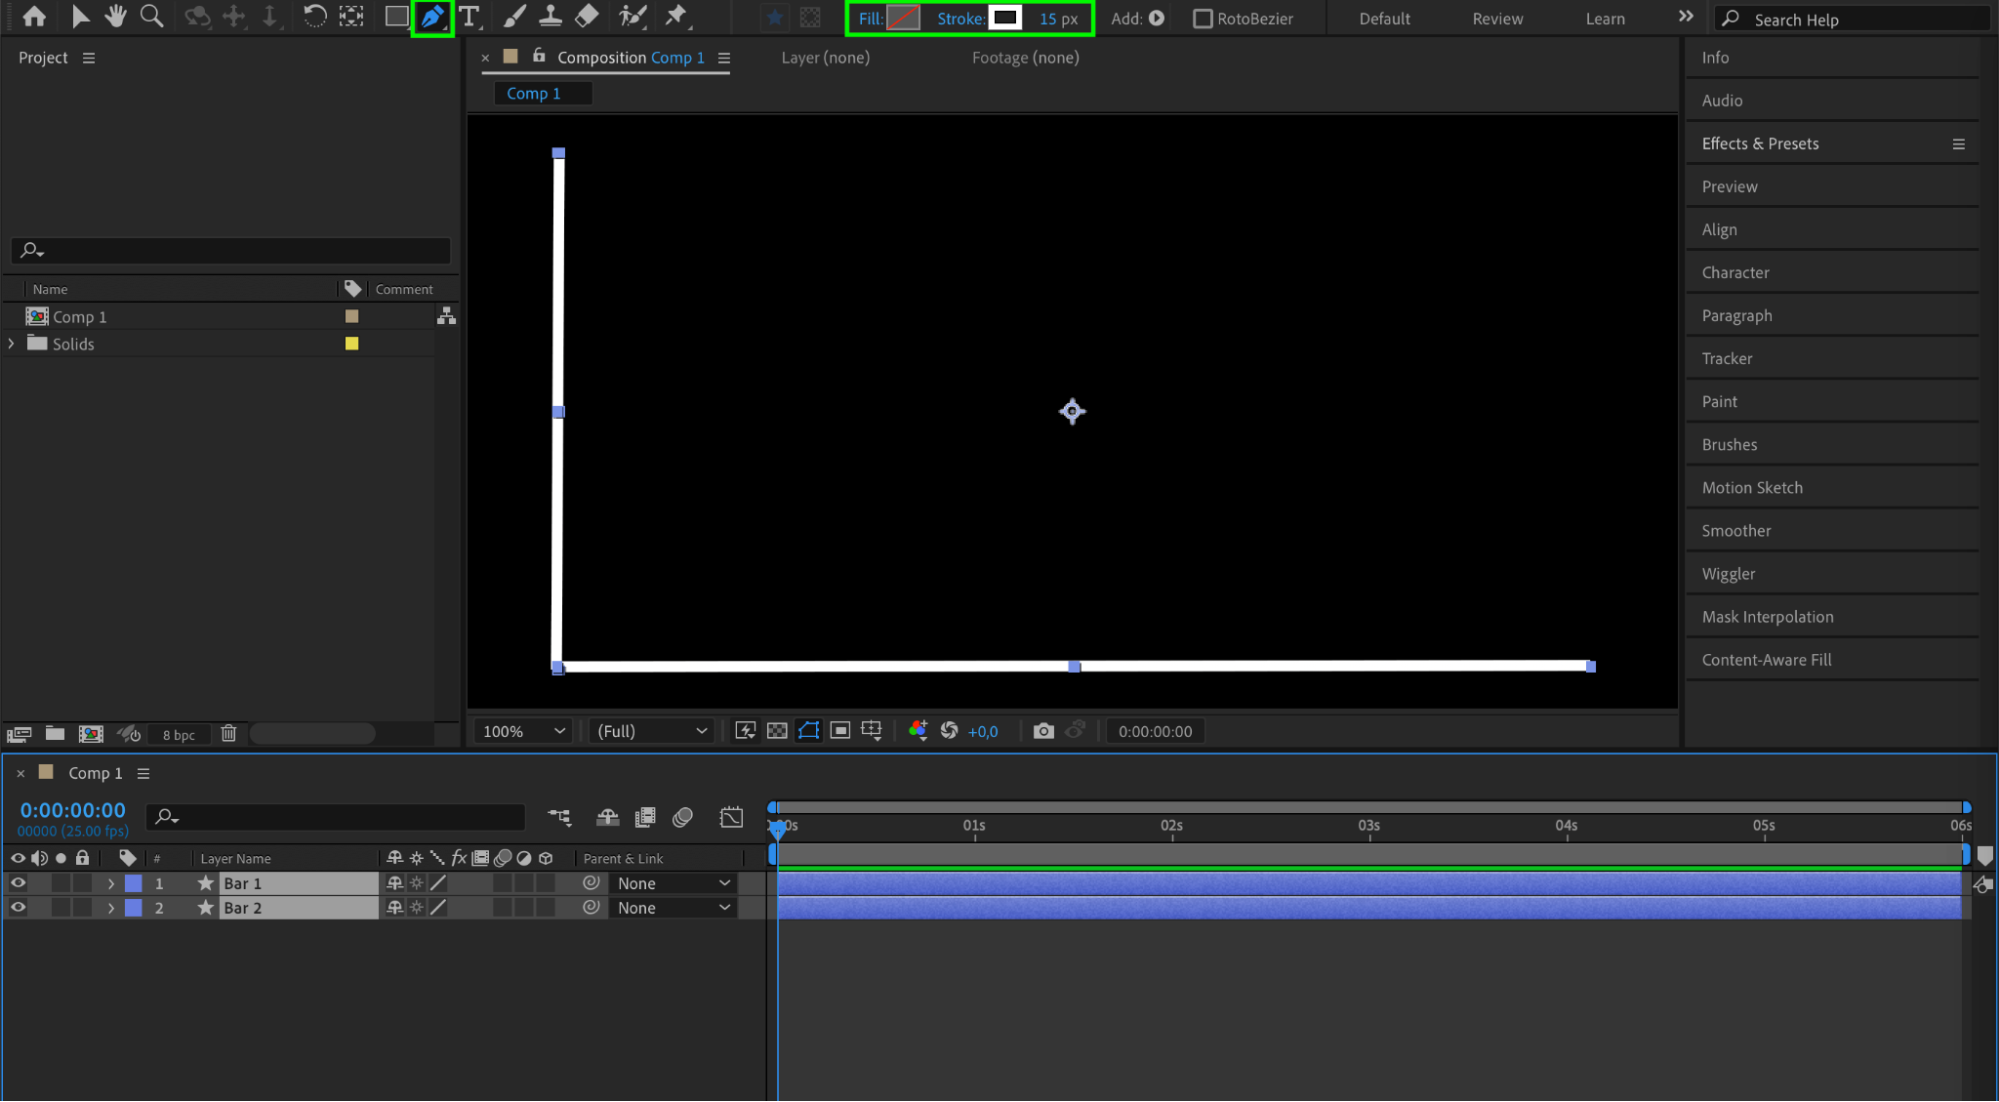 Step 4: Add Trim Paths to Bars
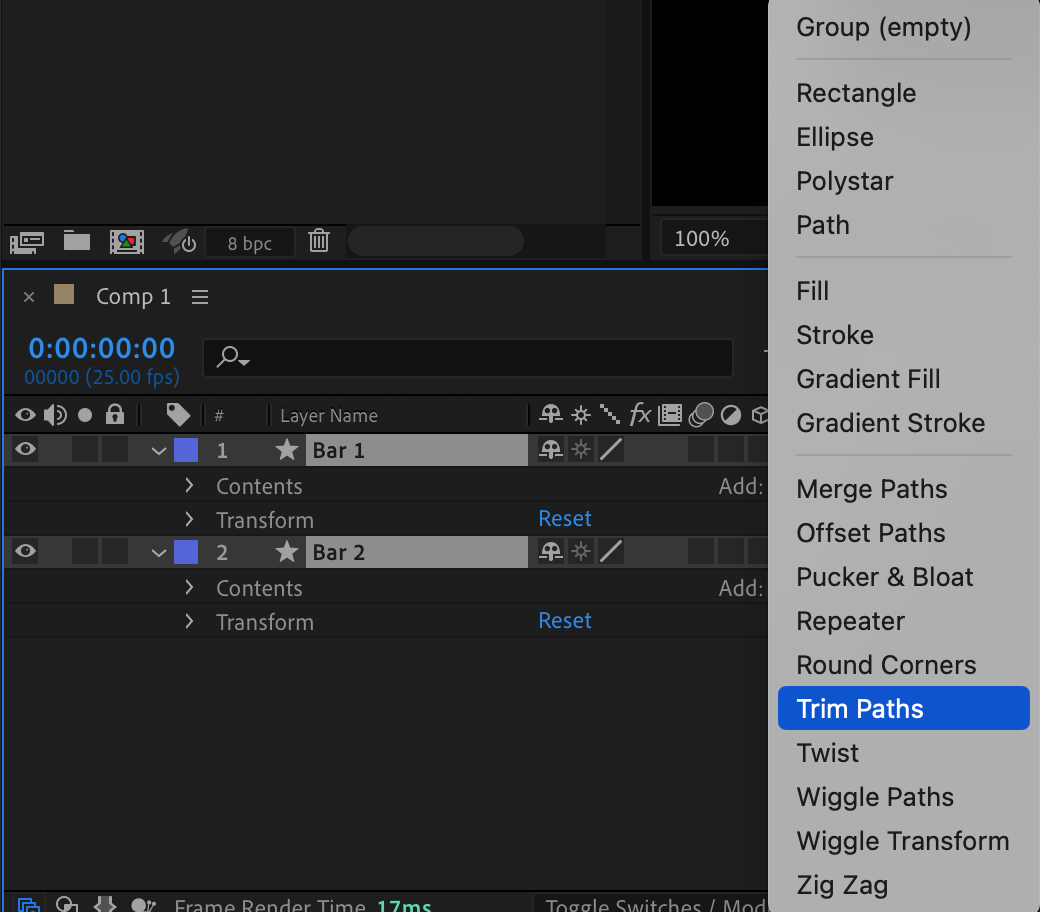
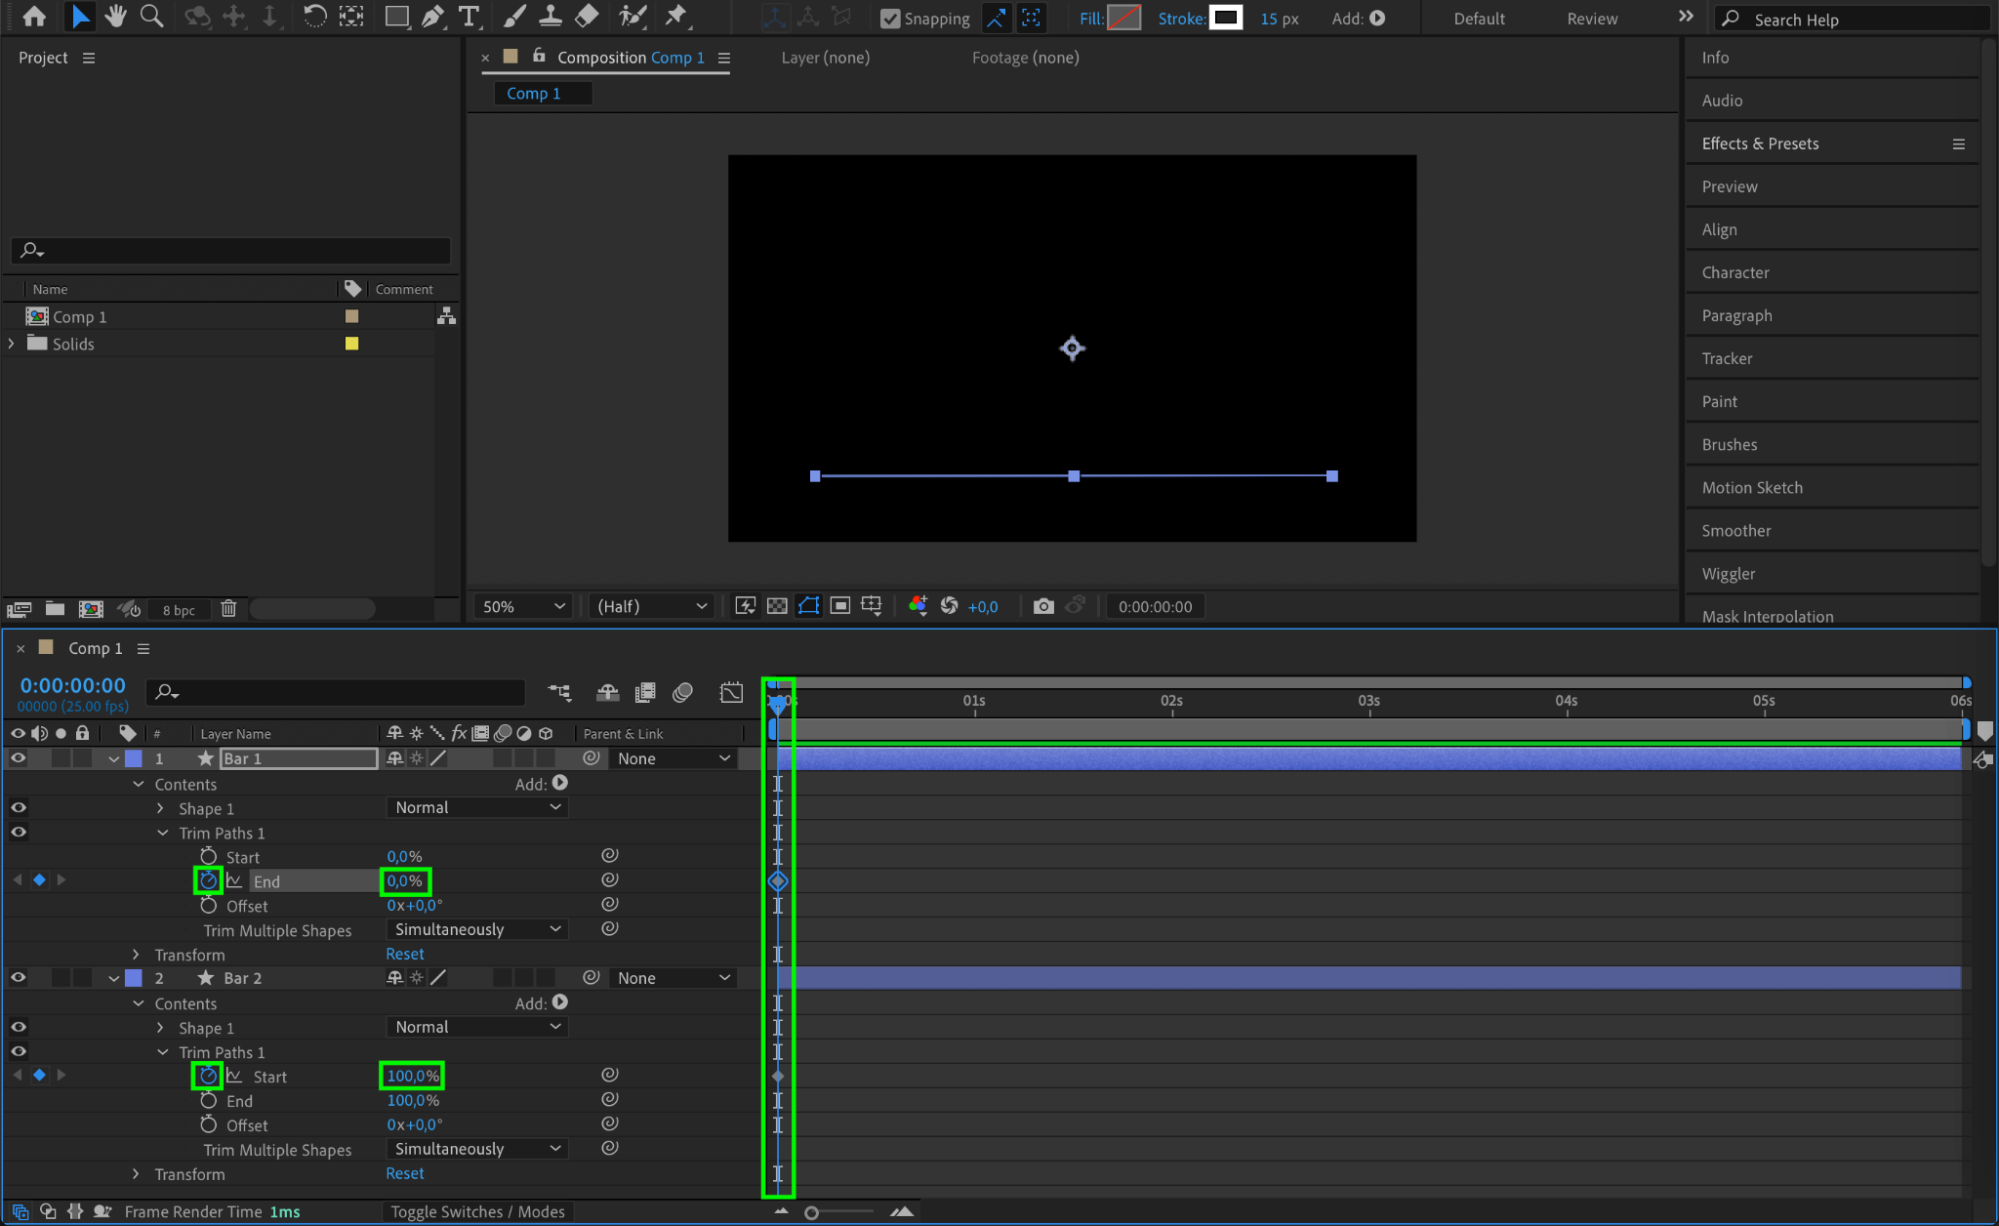
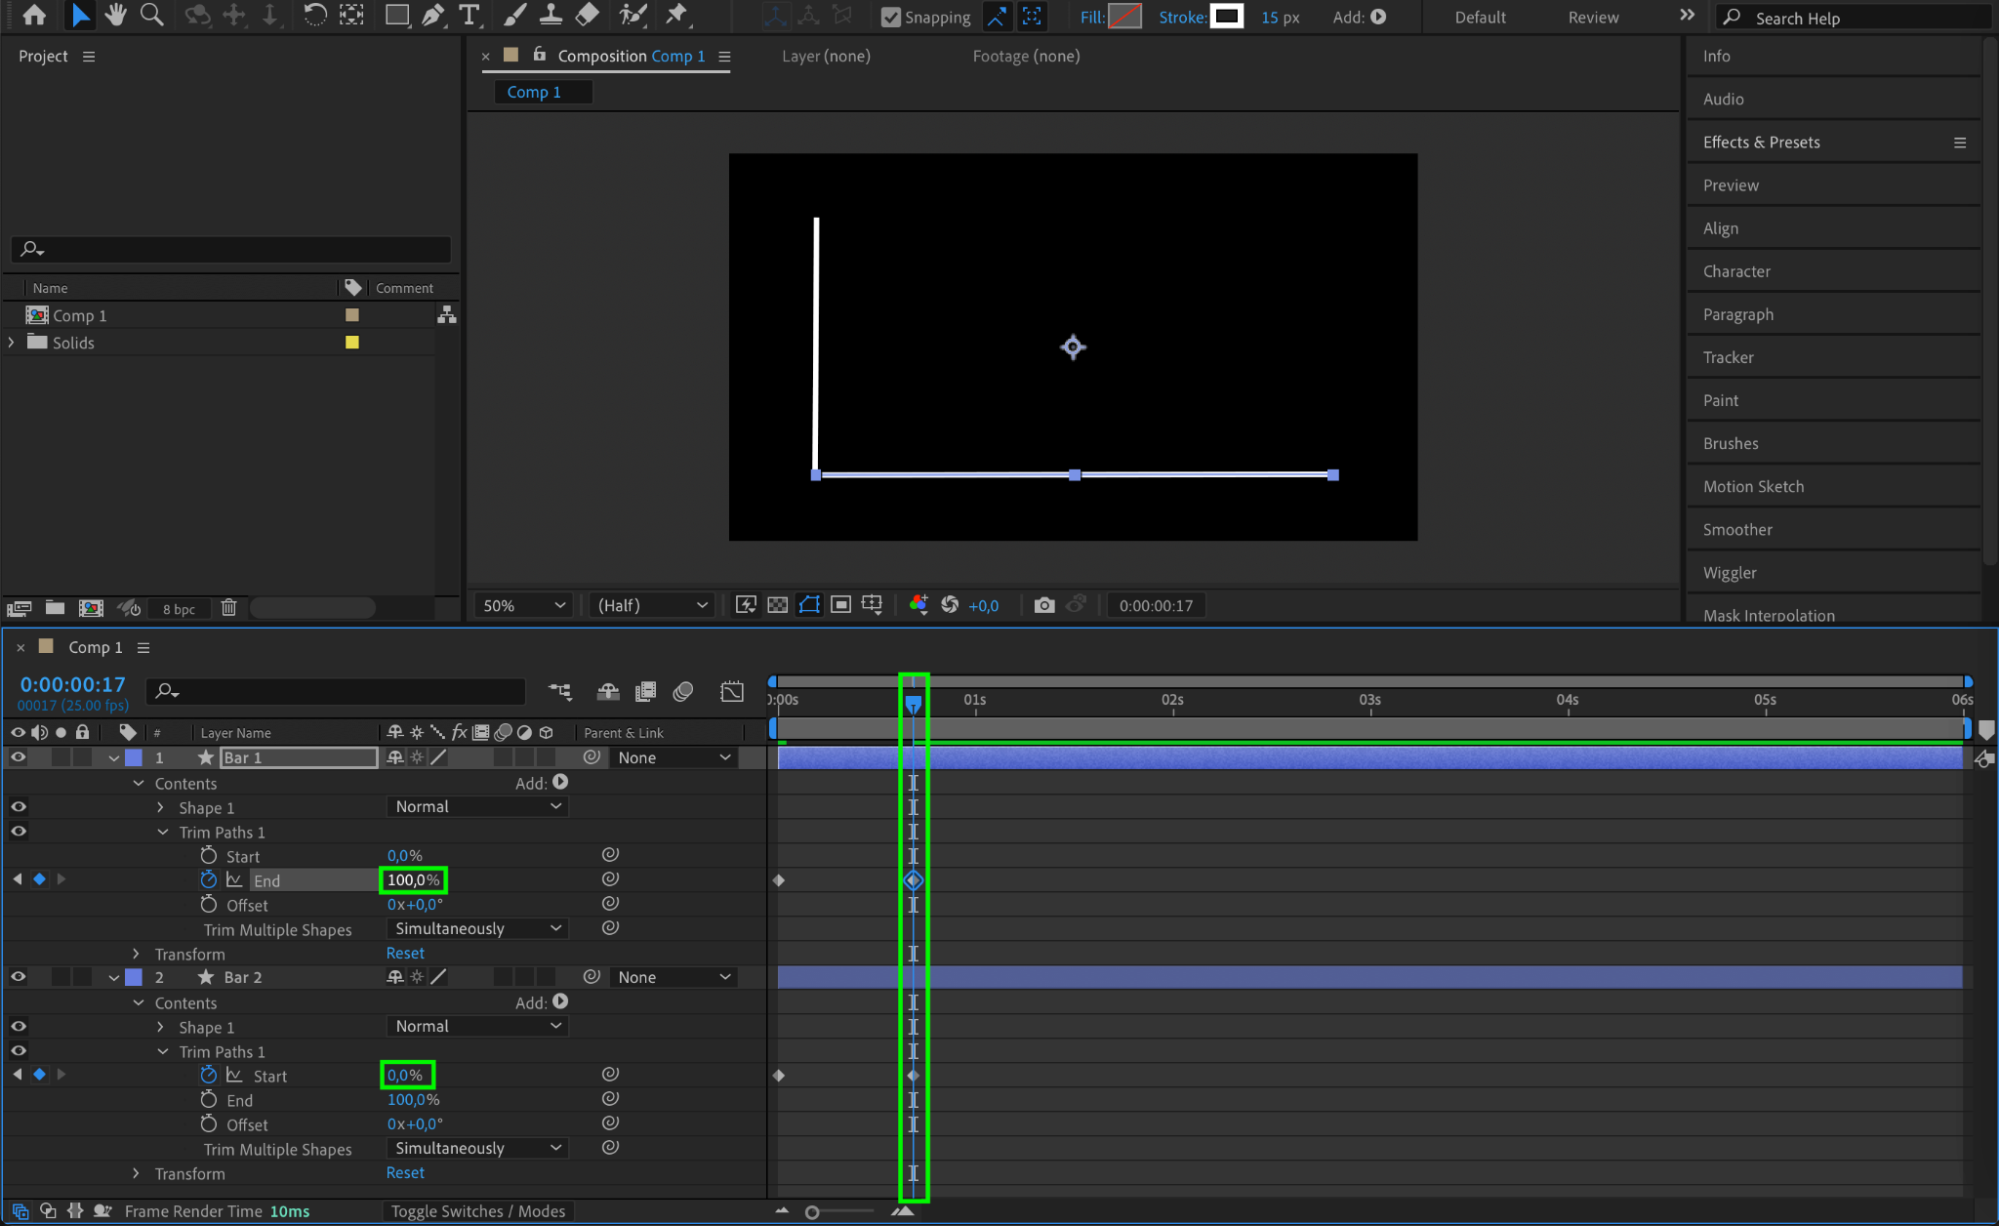
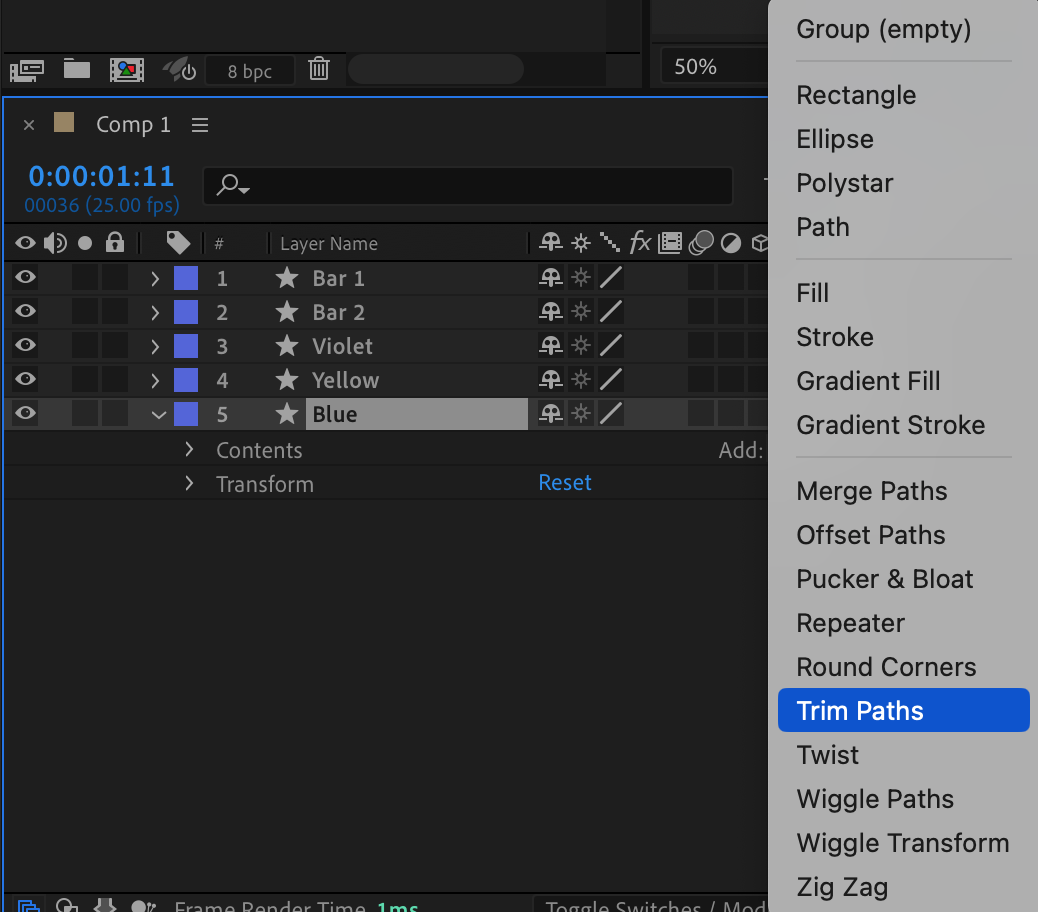
Select each bar, click the “Add” button, and choose “Trim Paths” from the submenu. Animate the Start or End parameters with keyframes to create a smooth animation for each bar.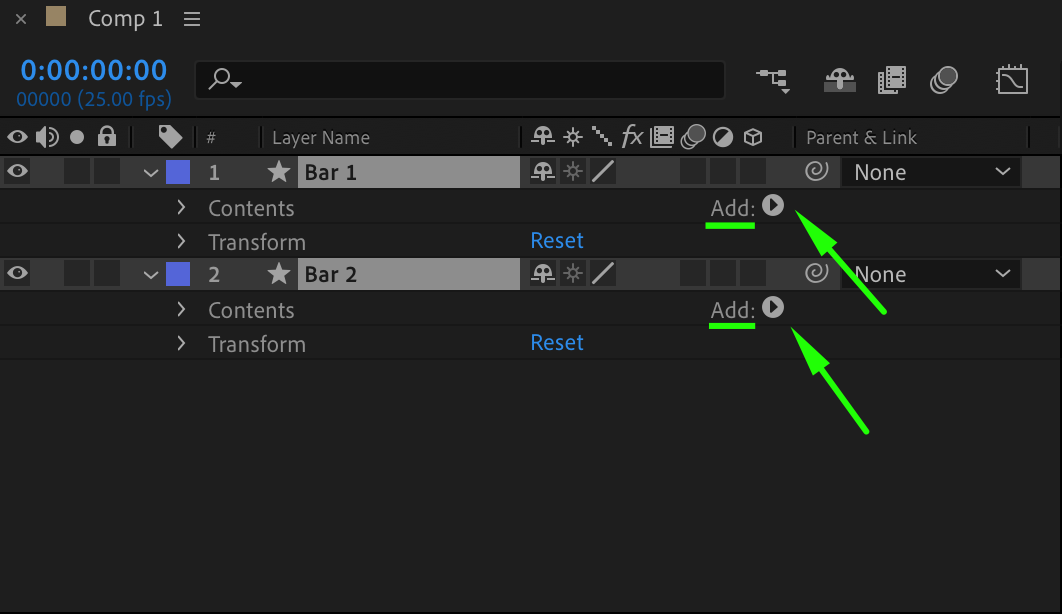
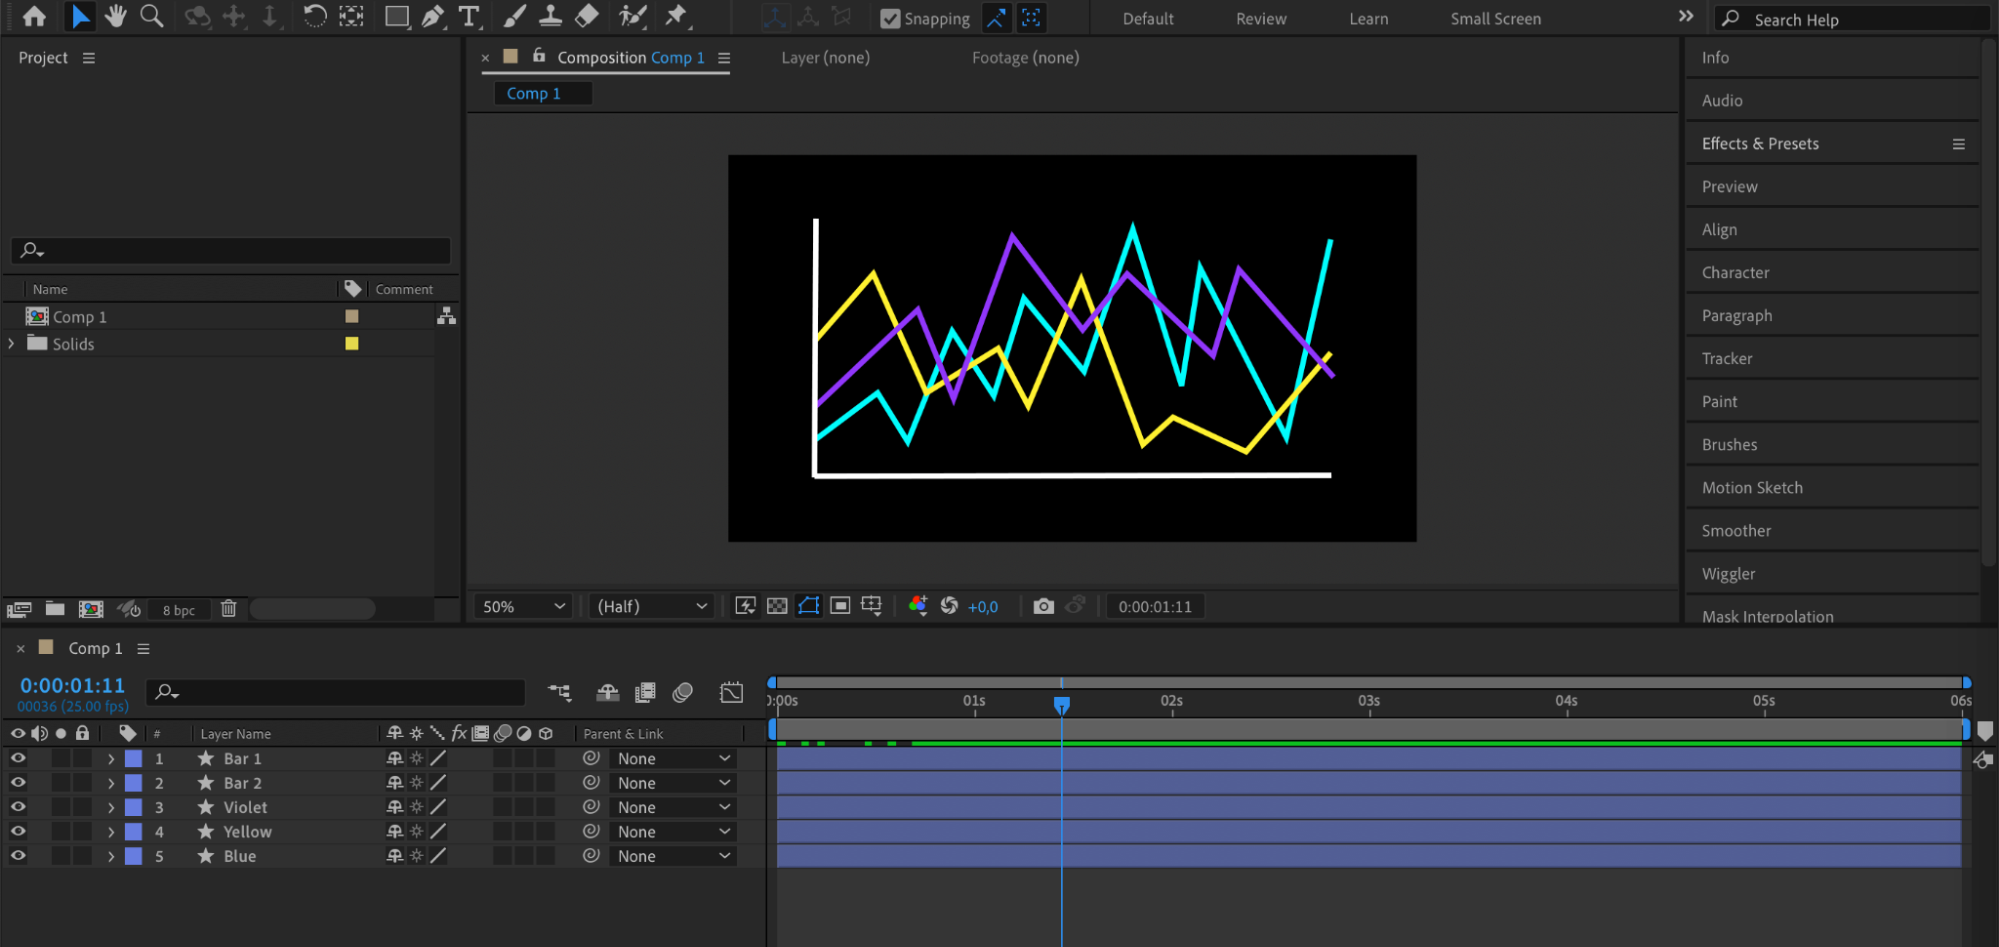
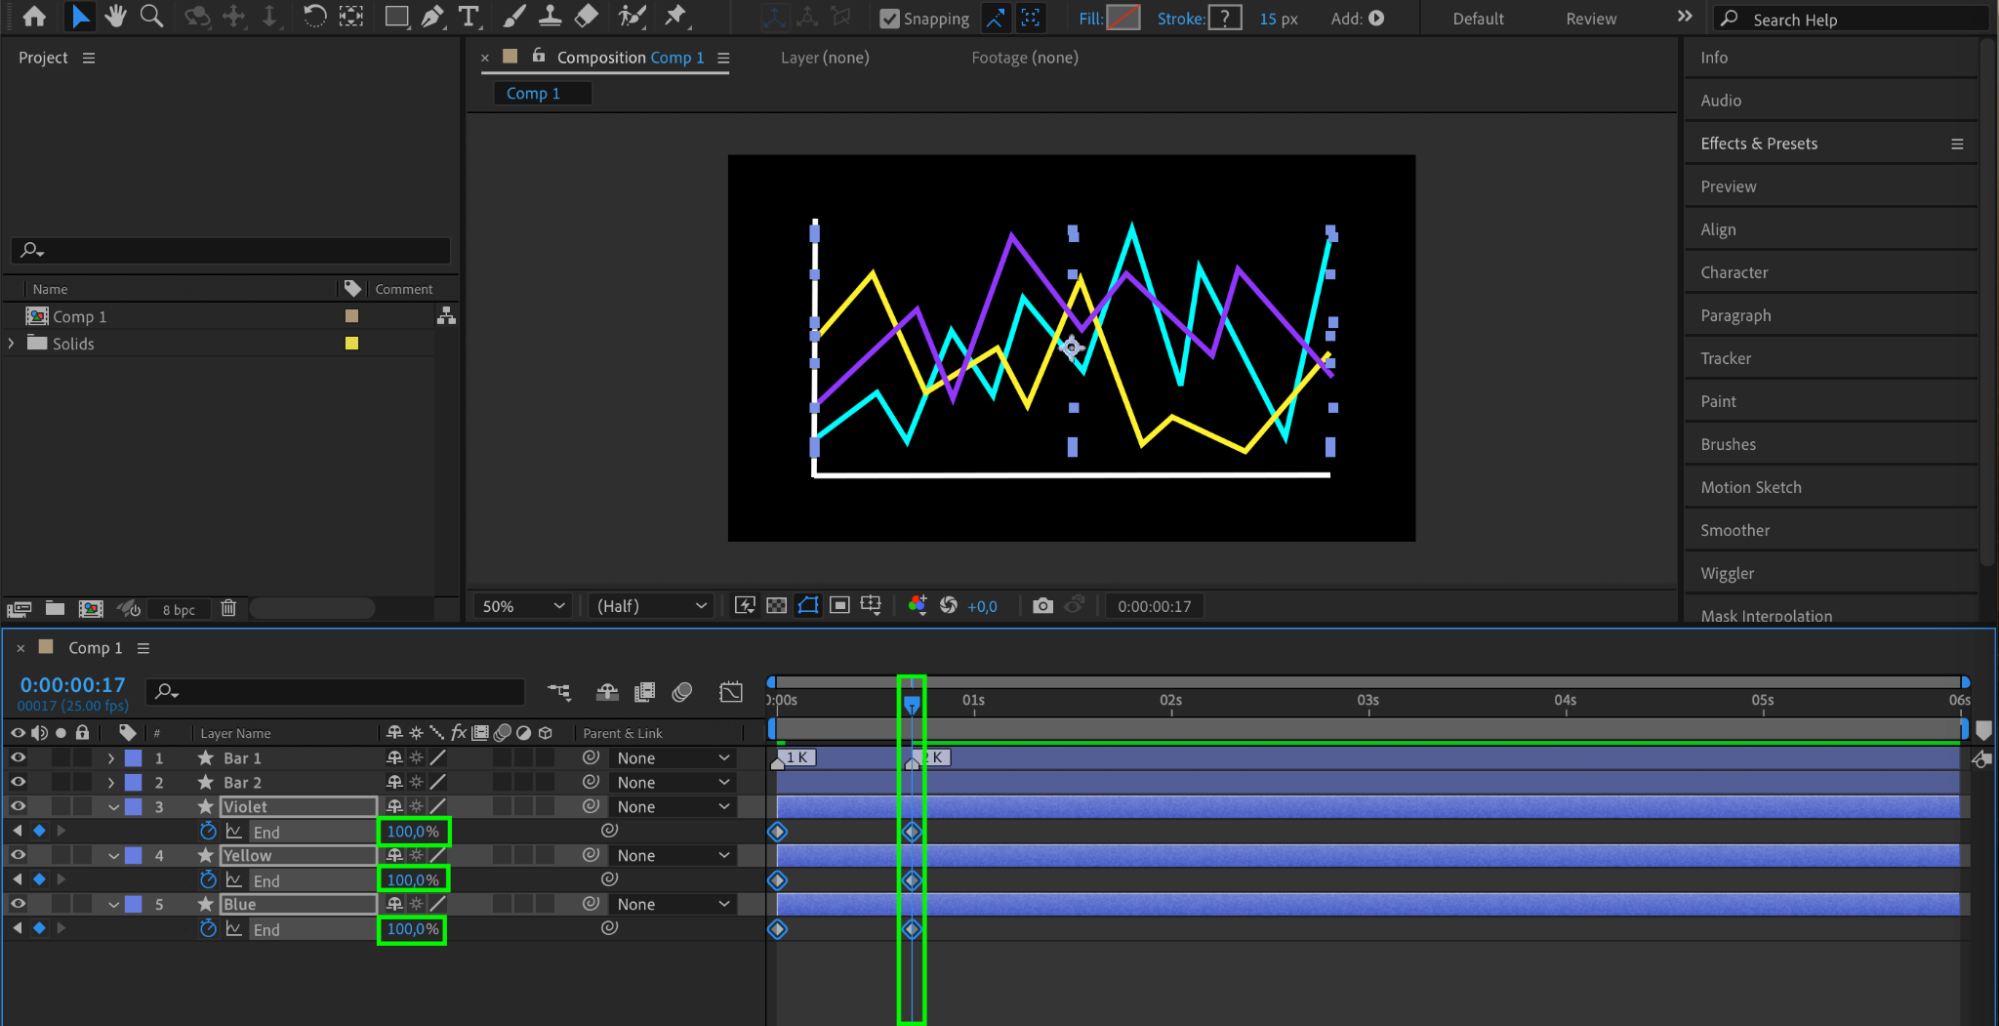
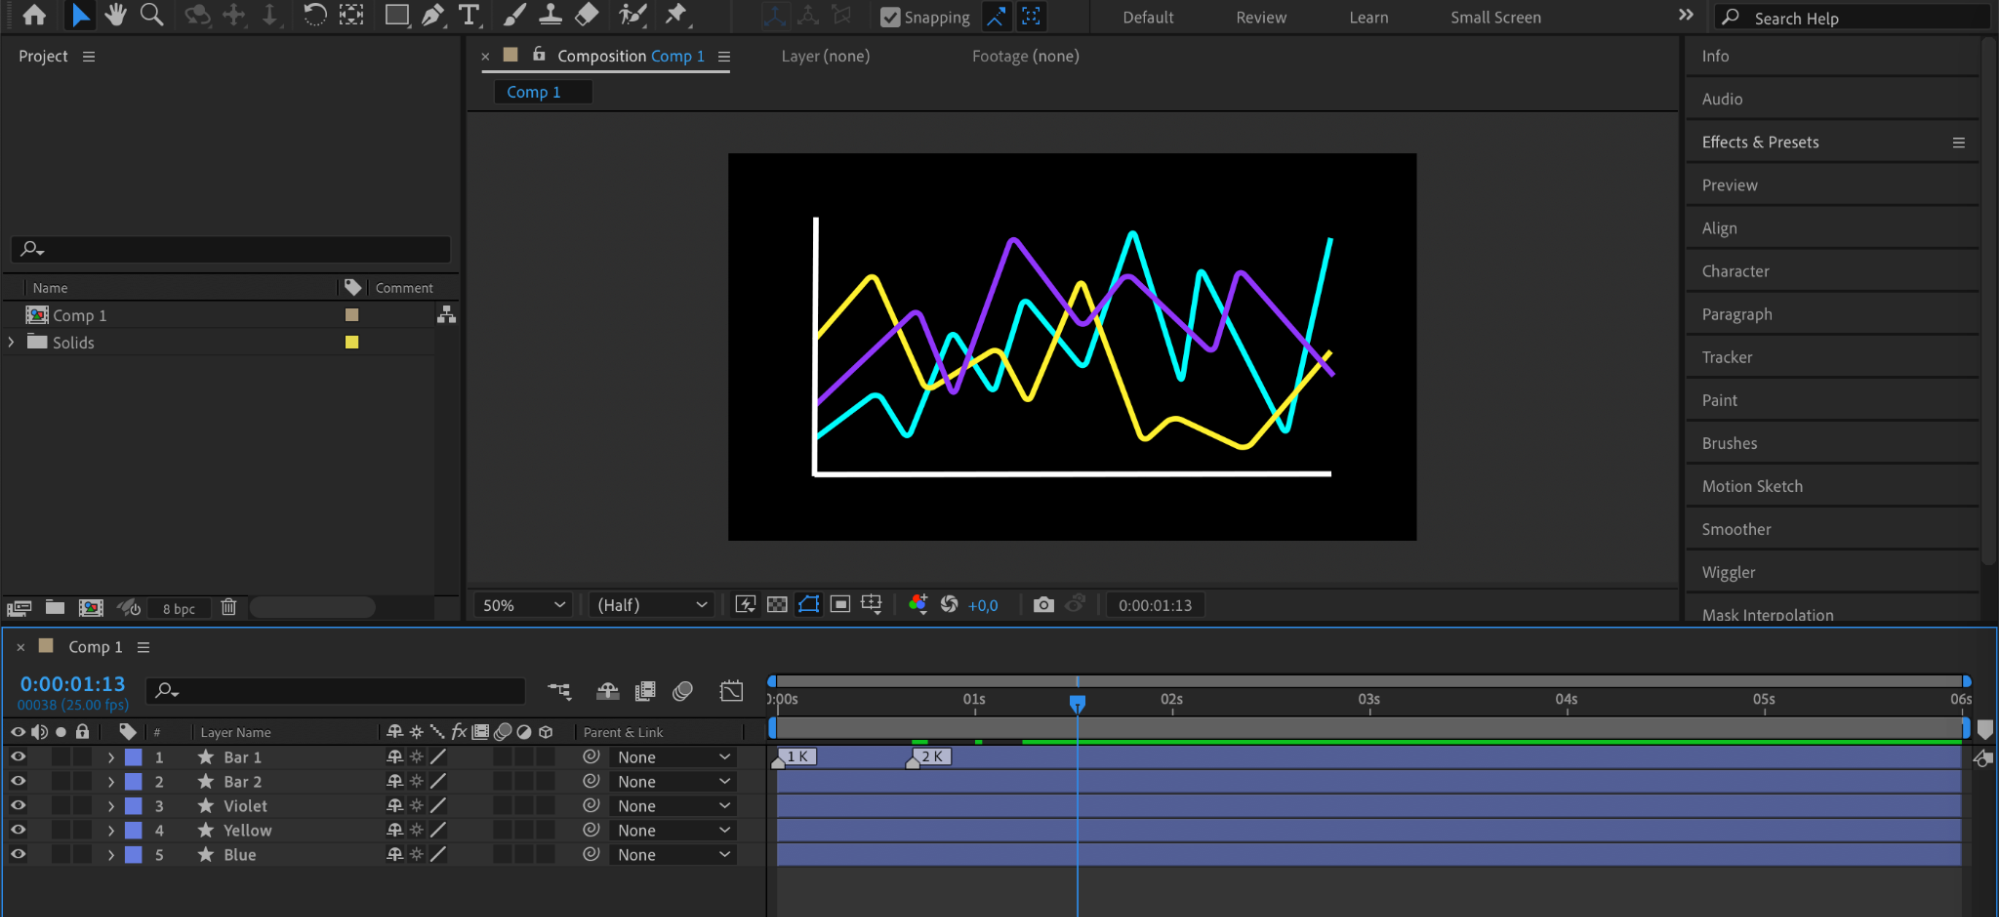
 Step 5: Create Graph Curves
Get 10% off when you subscribe to our newsletter
Draw the required number of curves for your graph, each in different colors, to represent various data points. Use the Pen Tool to draw these curves.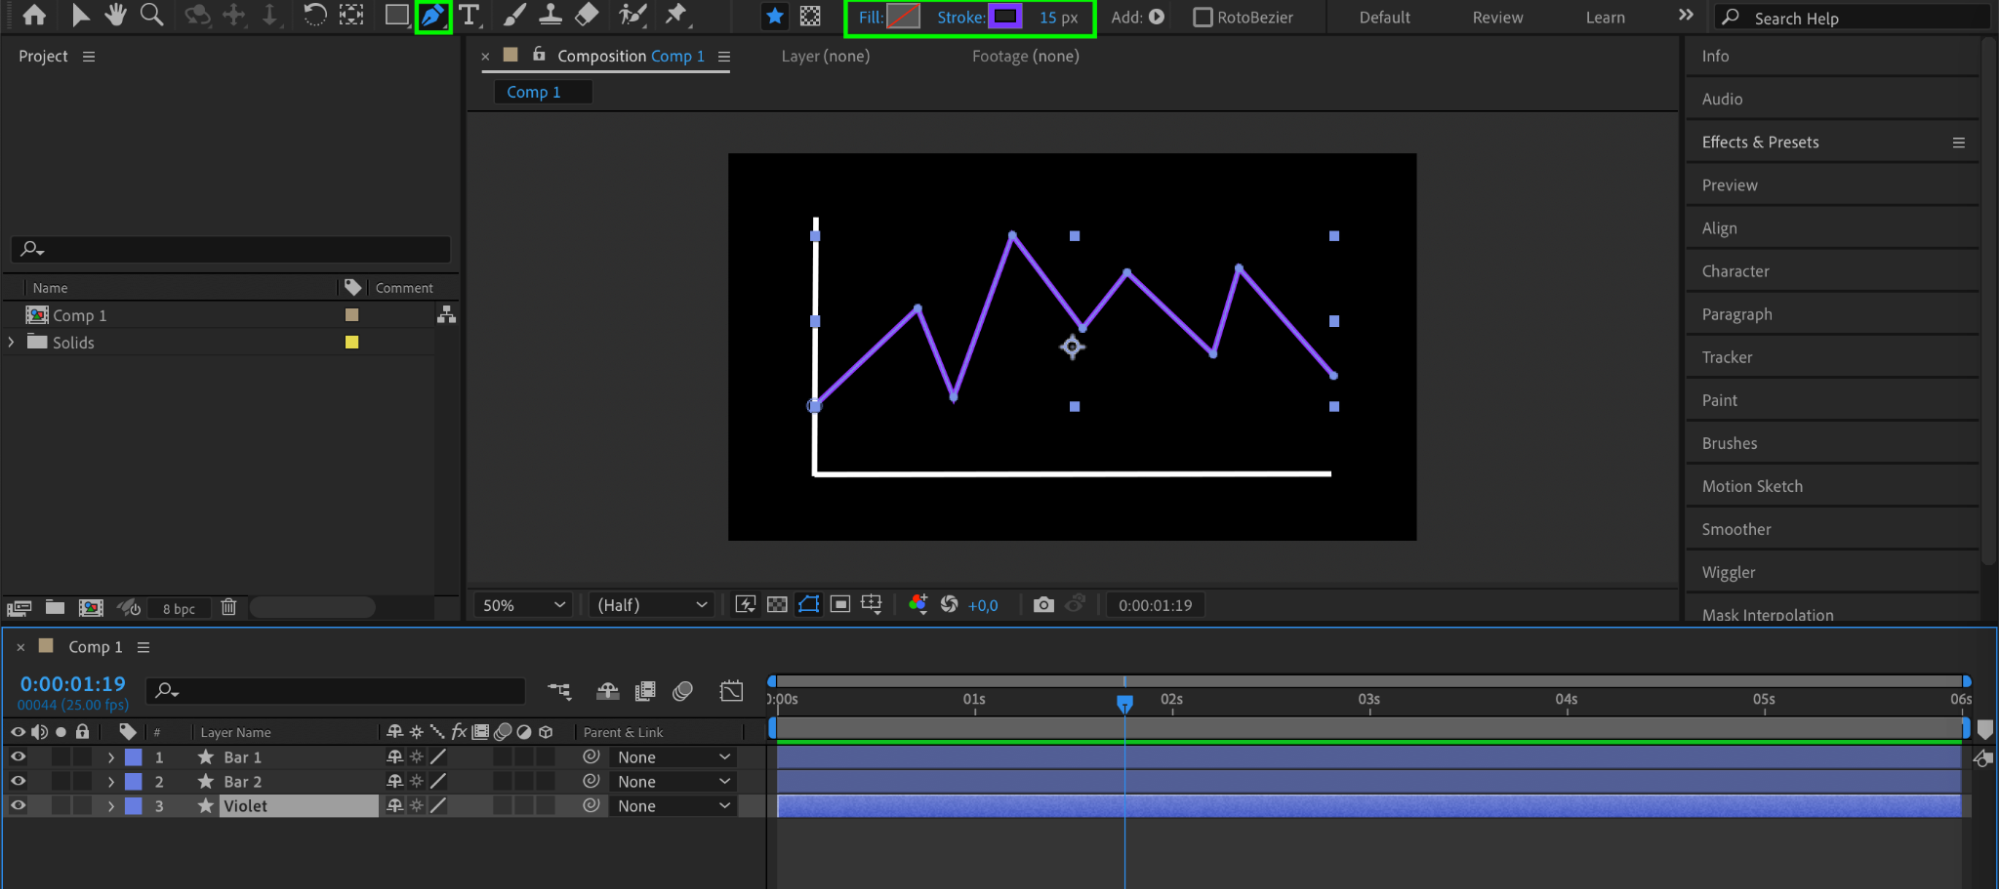
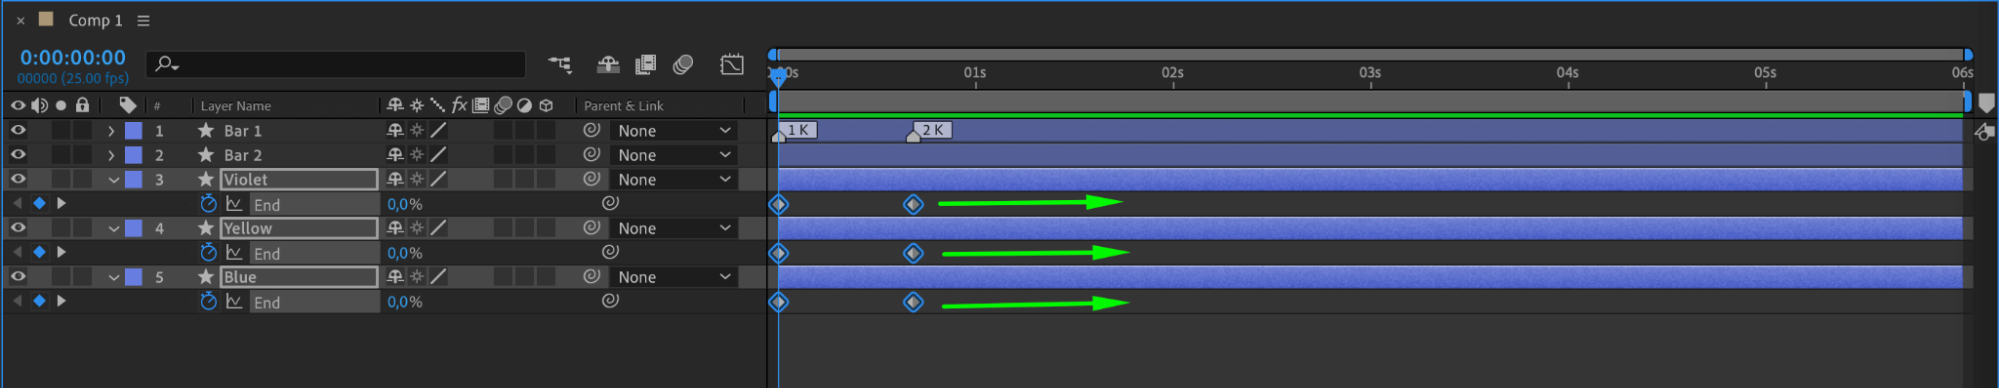
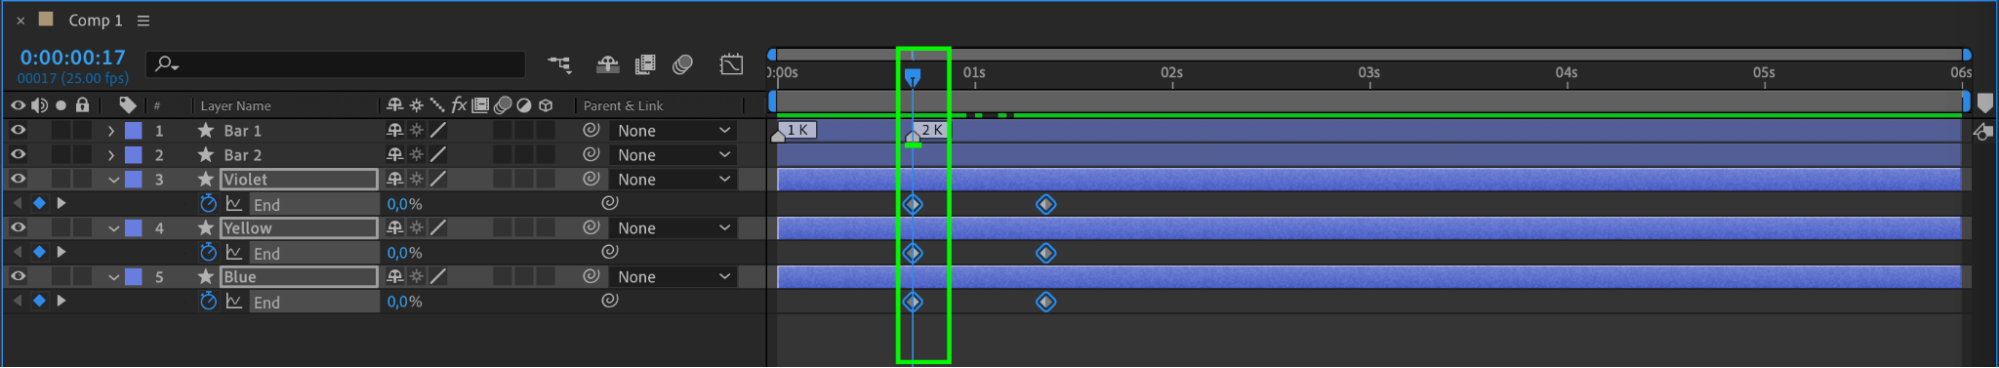
Step 6: Add Trim Paths to Curves
Get 10% off when you subscribe to our newsletter
For each curve, click the “Add” button and choose “Trim Paths.” Animate the End parameter with keyframes to create a dynamic entrance for each curve.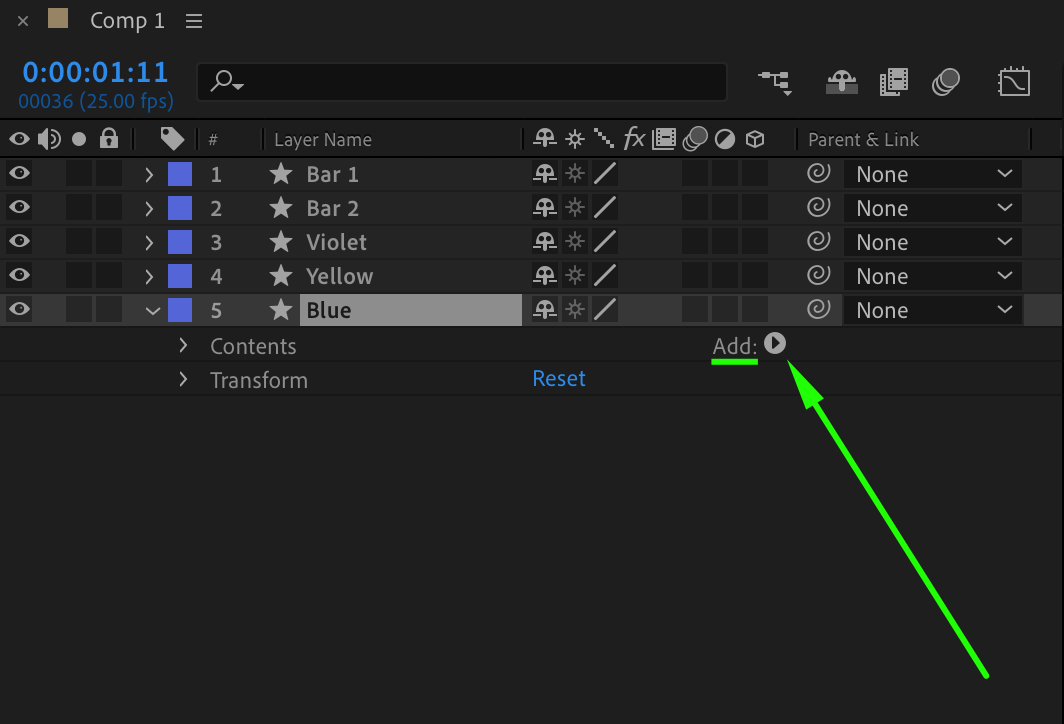
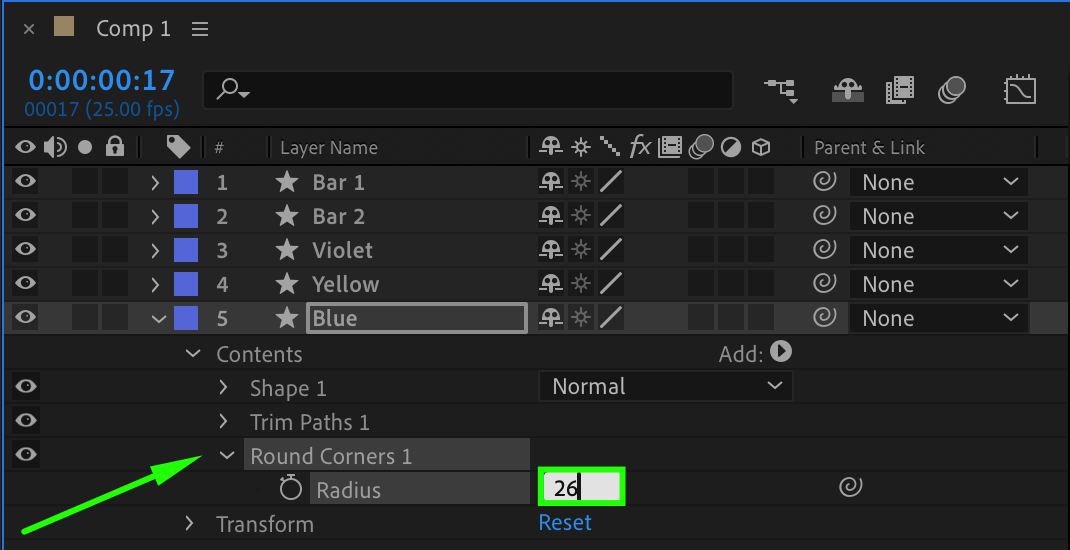
 Step 7: Round the Corners of Curves
For each curve, click the “Add” button and select “Round Corners.” Set the radius parameter to 26 to give your curves a smoother appearance.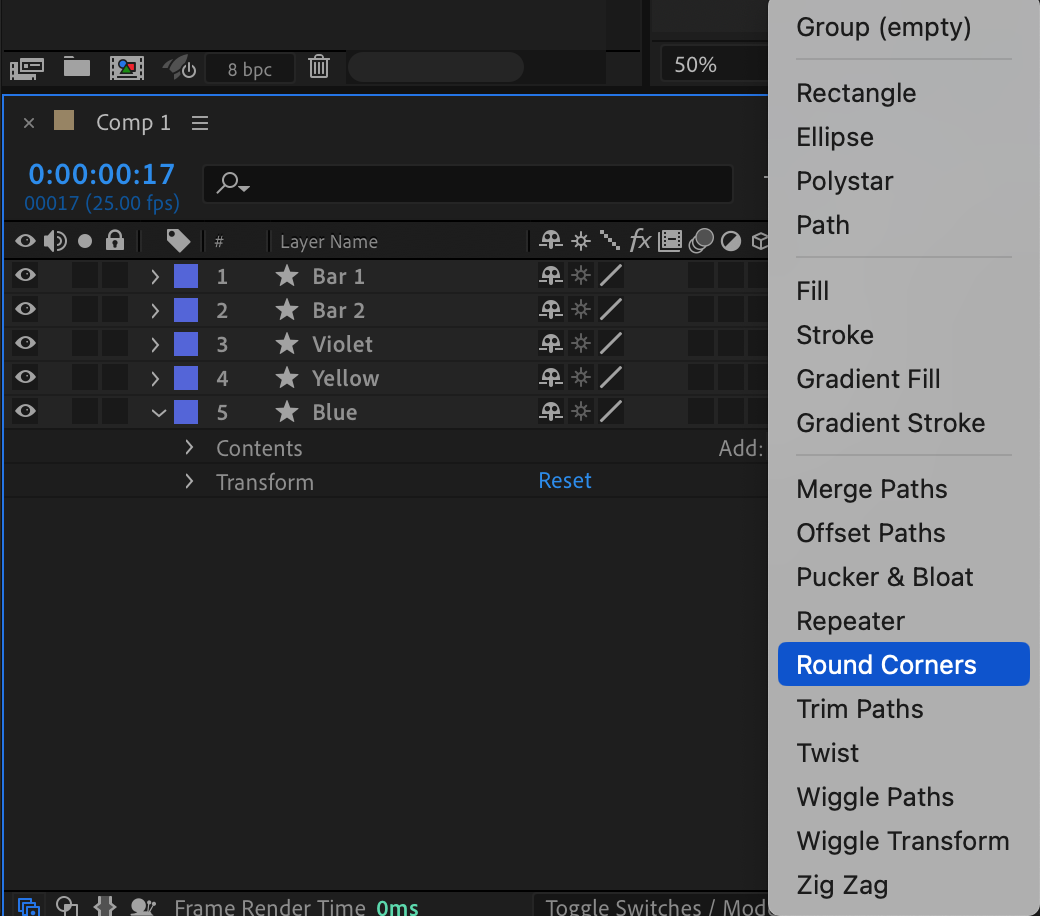
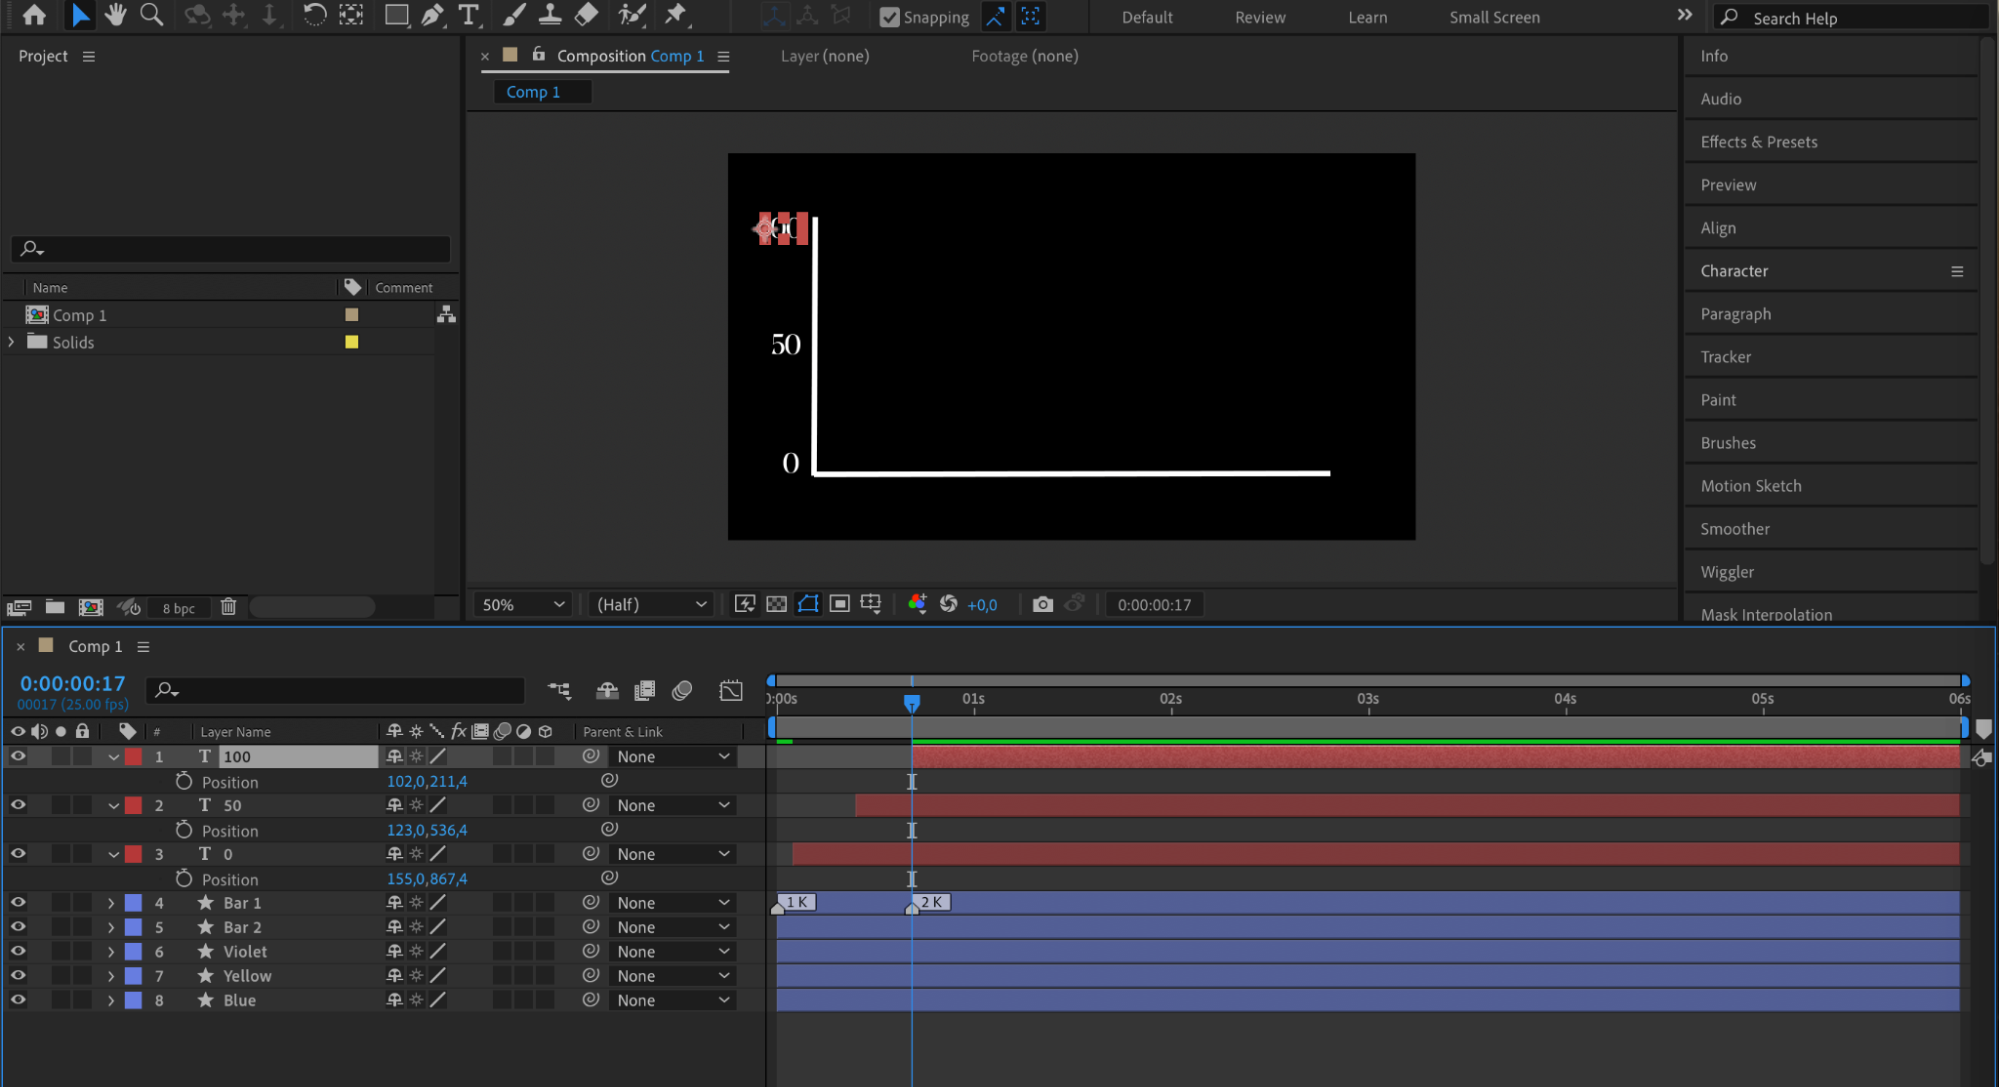
 Step 8: Add Measurement Labels
Get 10% off when you subscribe to our newsletter
Use the Type Tool (Ctrl/Cmd + T) to create measurement labels for your graph (e.g., 0, 50, 100). Customize the appearance of the text using the Character panel.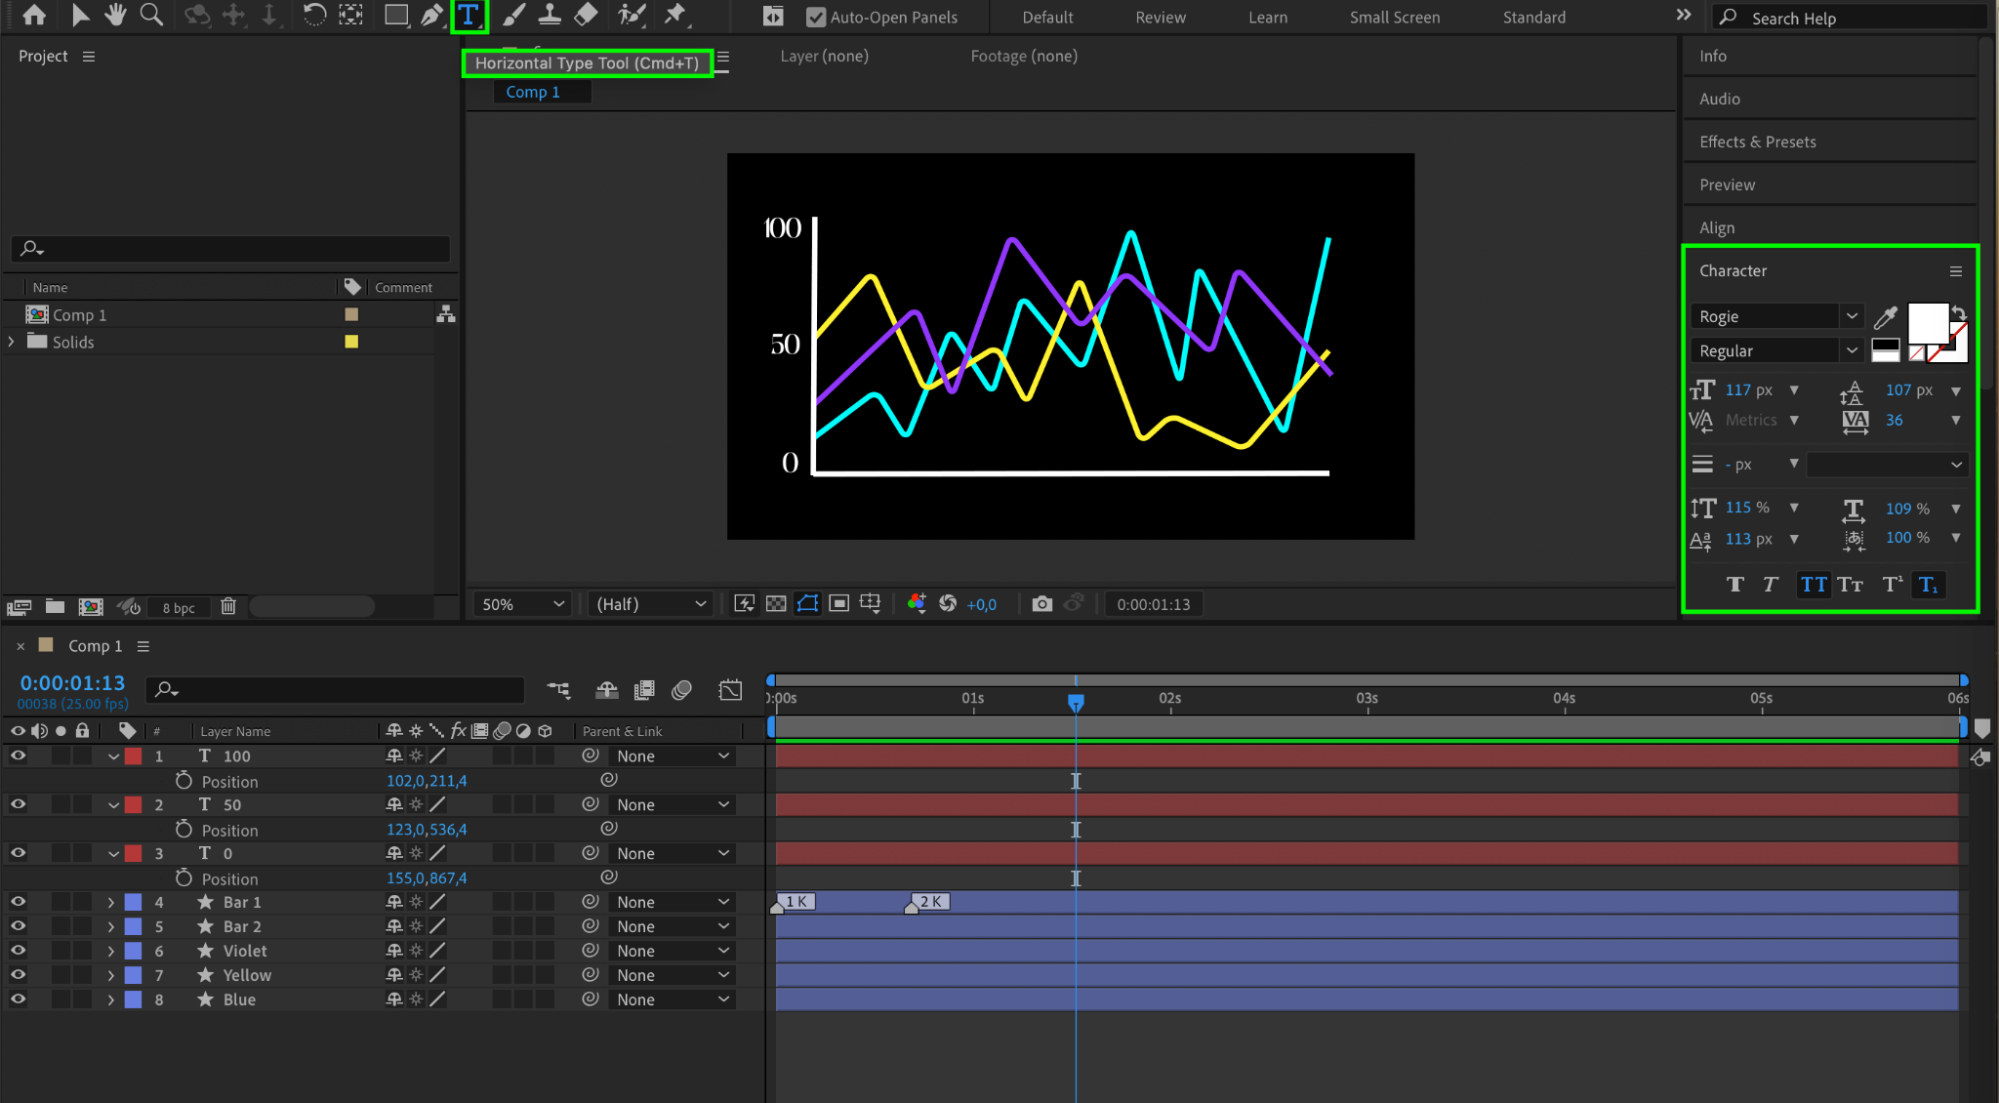 Step 9: Trim Measurement Layers
Use the Current Time Indicator and the shortcuts “Alt/Option + [” and “Alt/Option + ]” to trim your layers, ensuring each measurement label appears when the corresponding part of the graph is visible.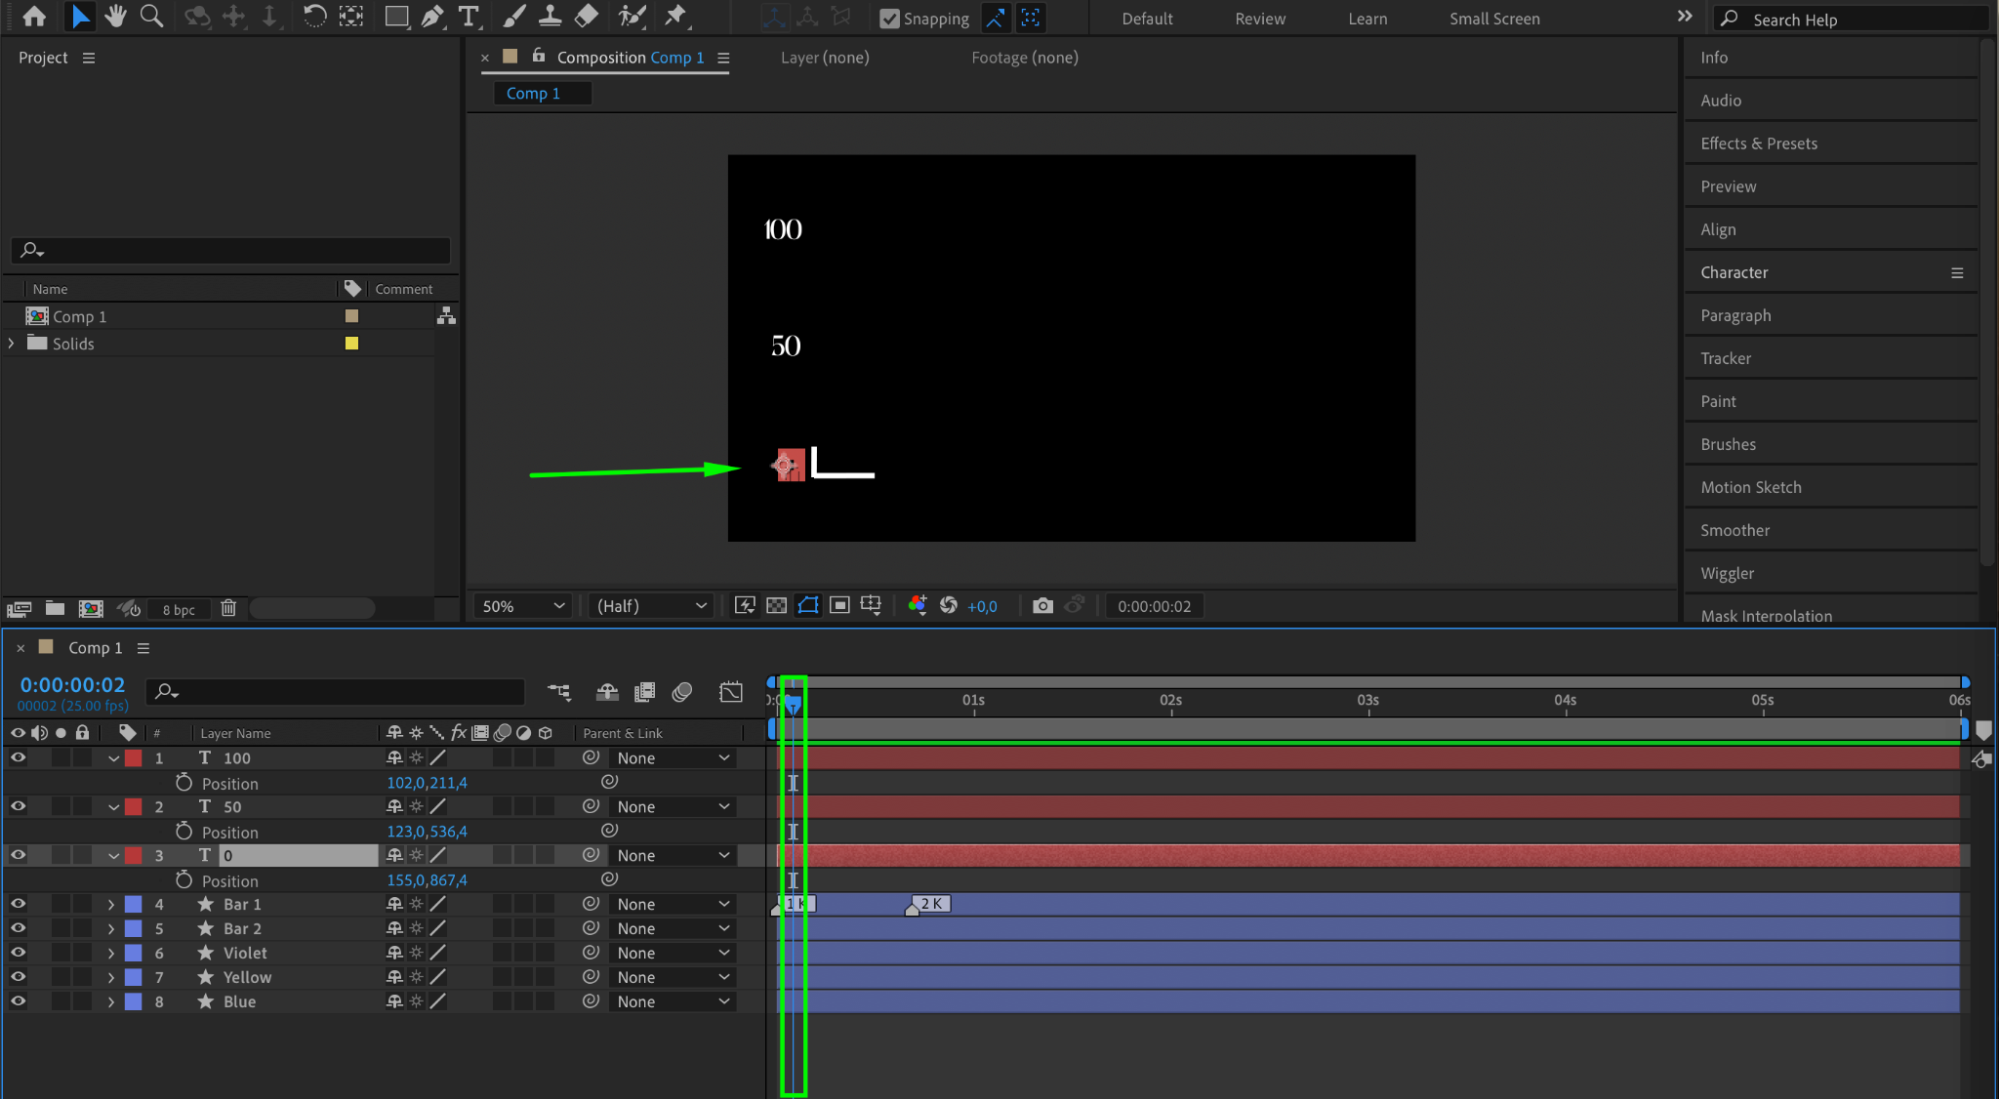
 Step 10: Animate Curve Appearances
Manipulate the keyframes to create a smooth, sequential appearance of each curve, ensuring a cohesive and professional animation flow.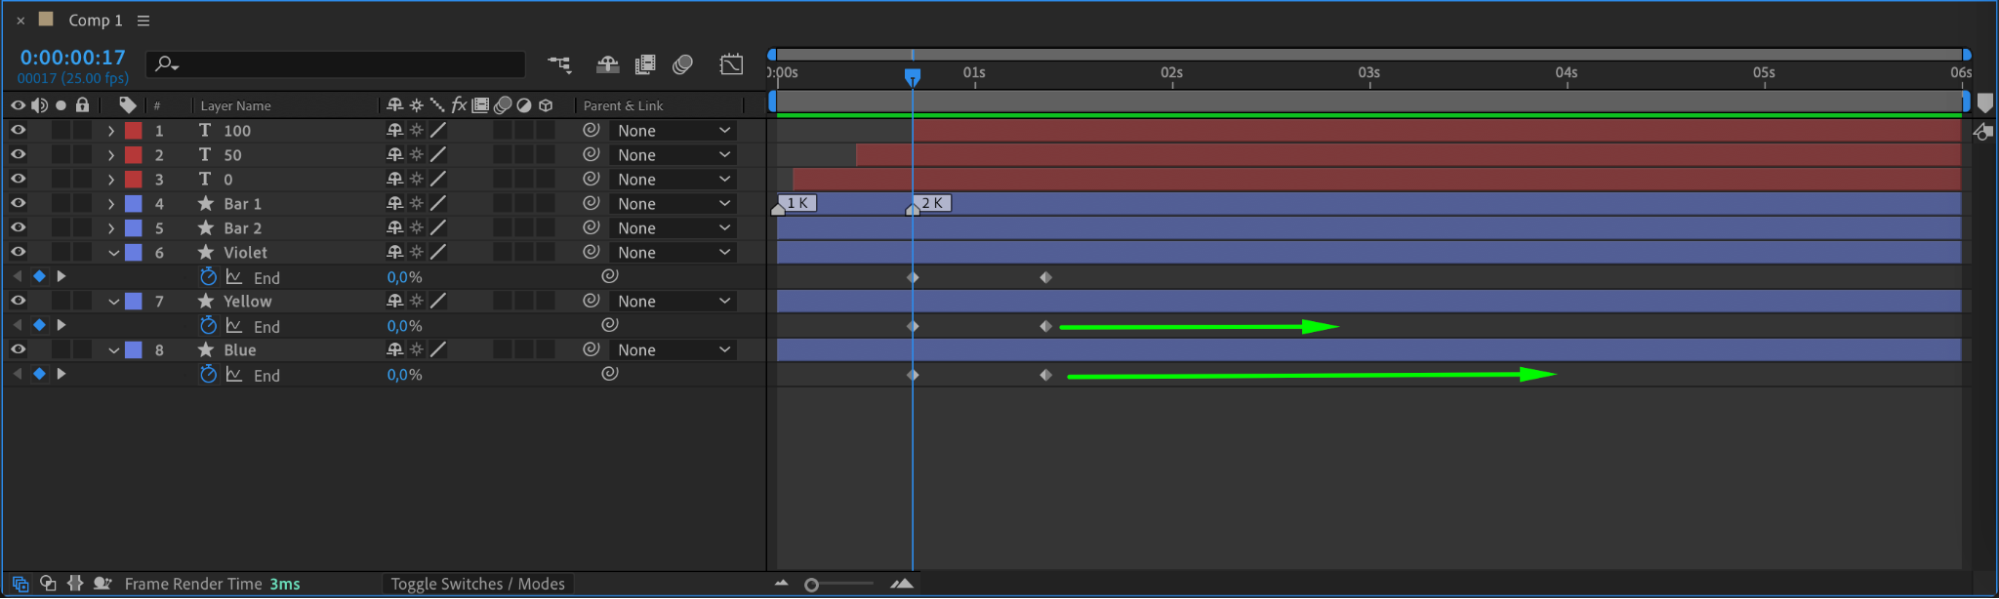
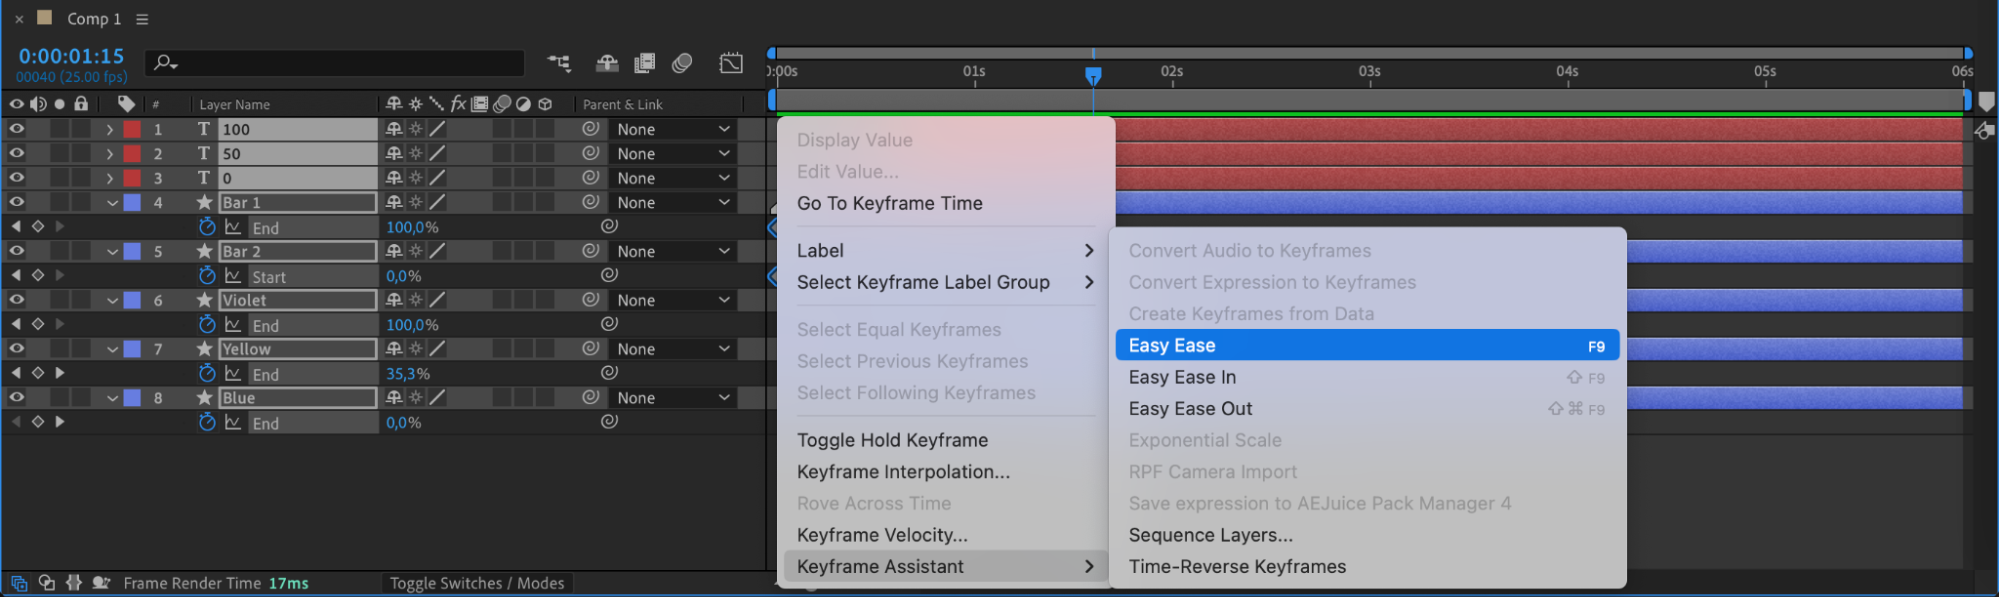
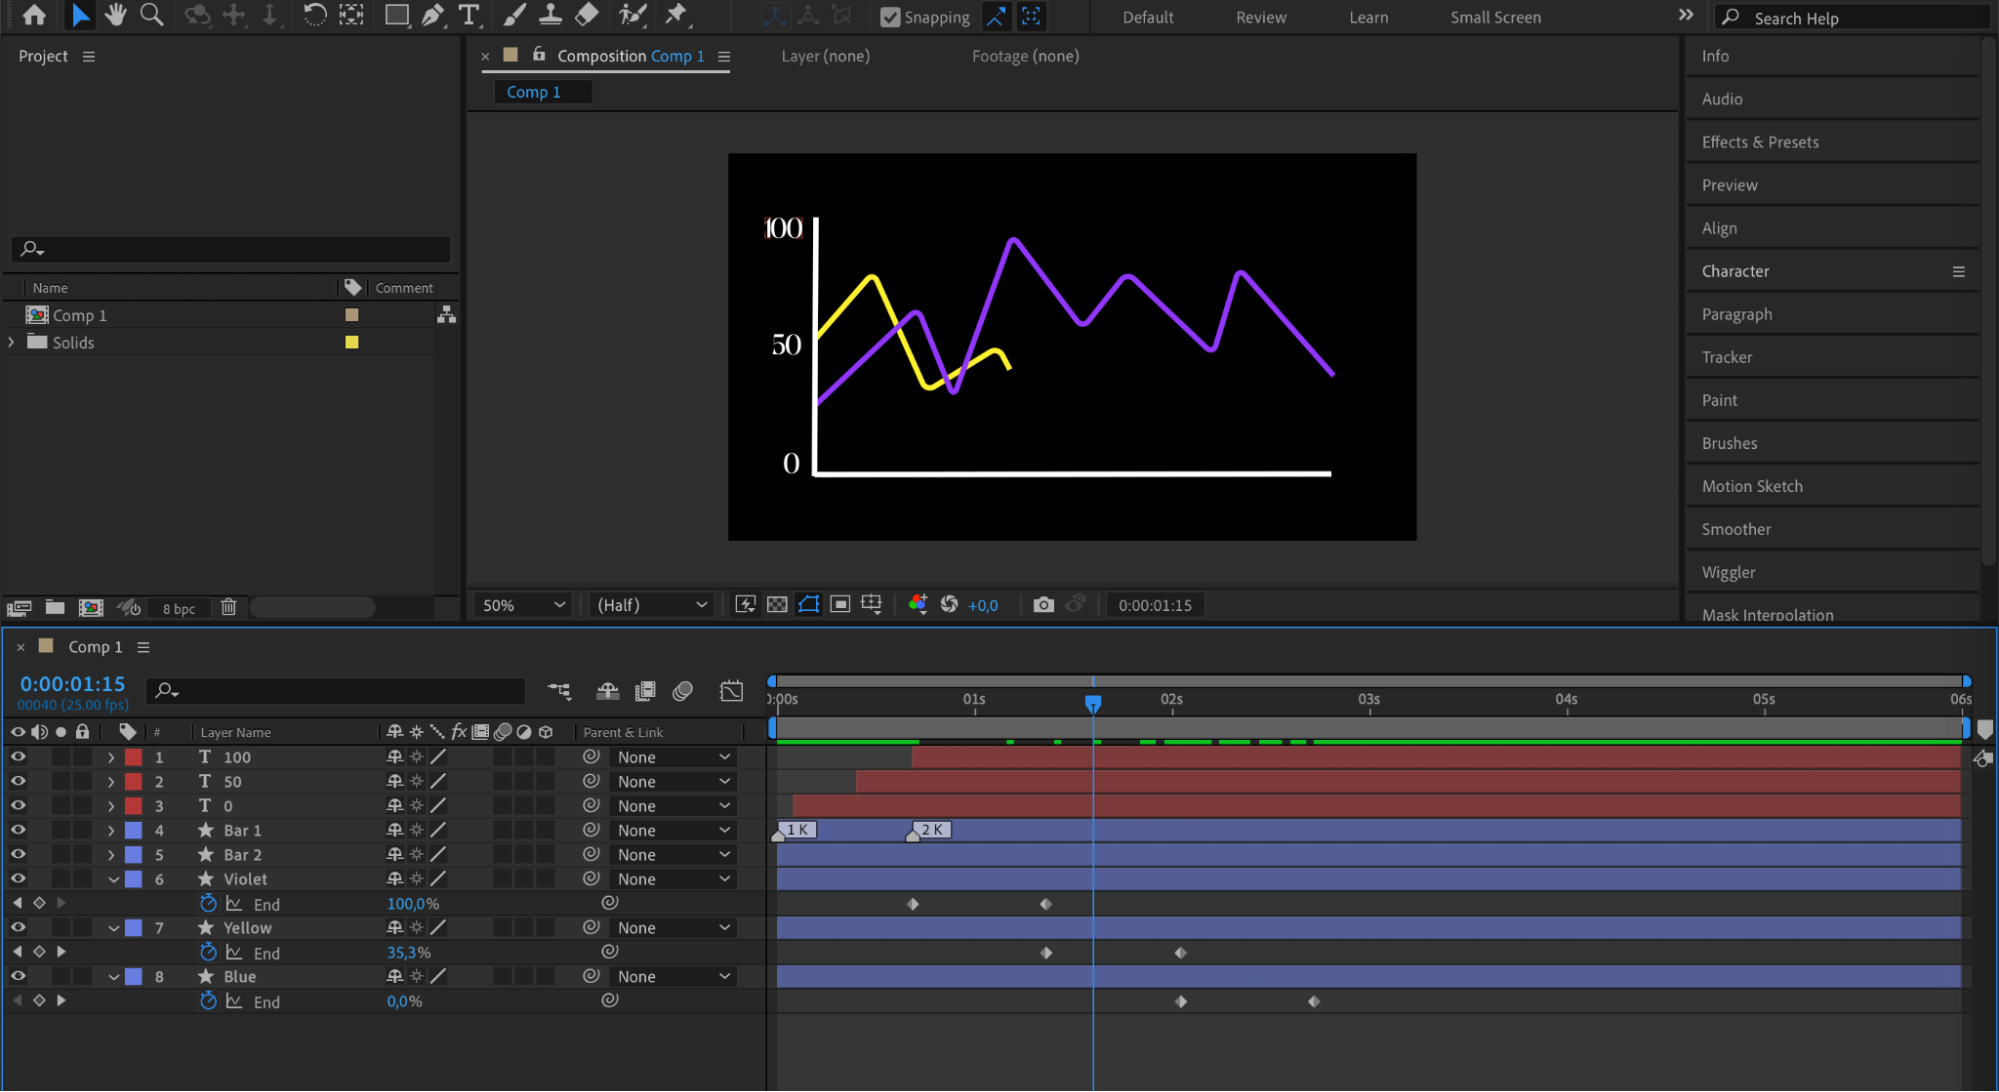 Step 11: Apply Easy Ease to Keyframes
Get 10% off when you subscribe to our newsletter
Select all created layers and use the shortcut “U” to display all keyframes. Right-click on the keyframes and choose Keyframe Assistant > Easy Ease to smooth out the animations.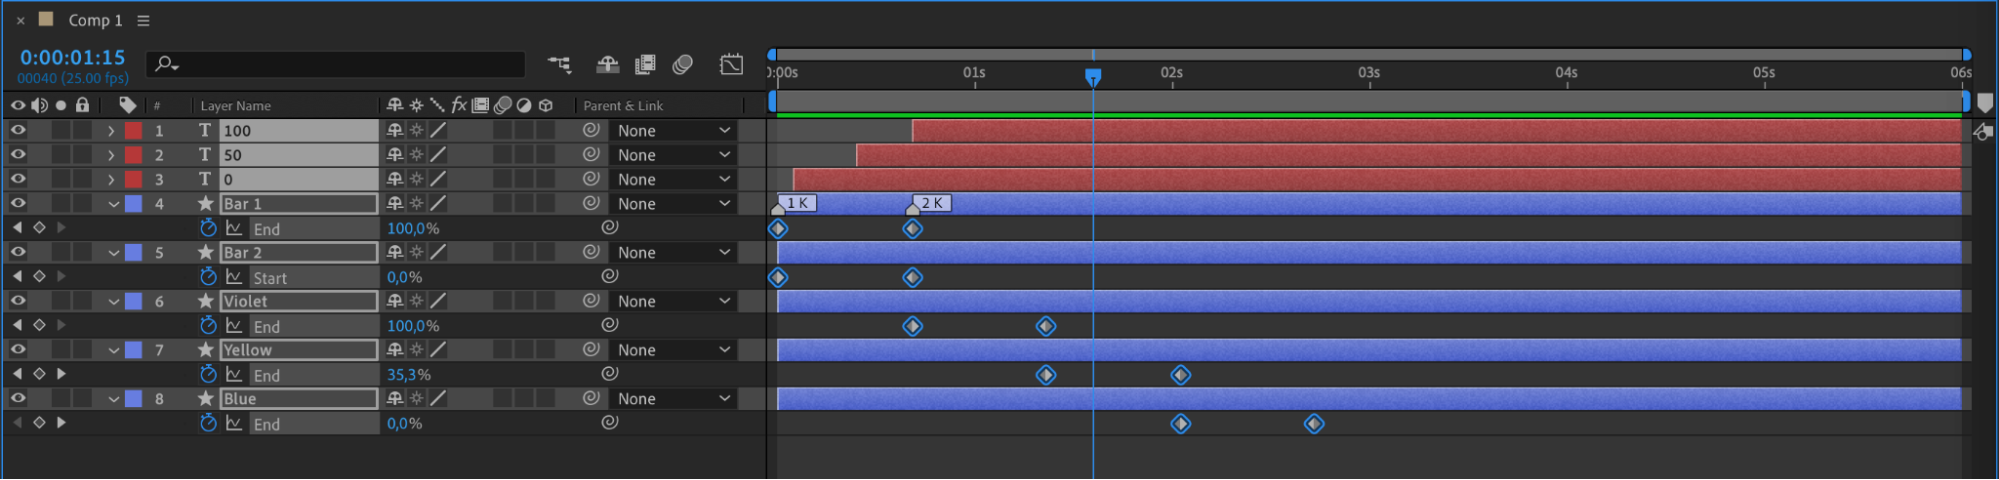
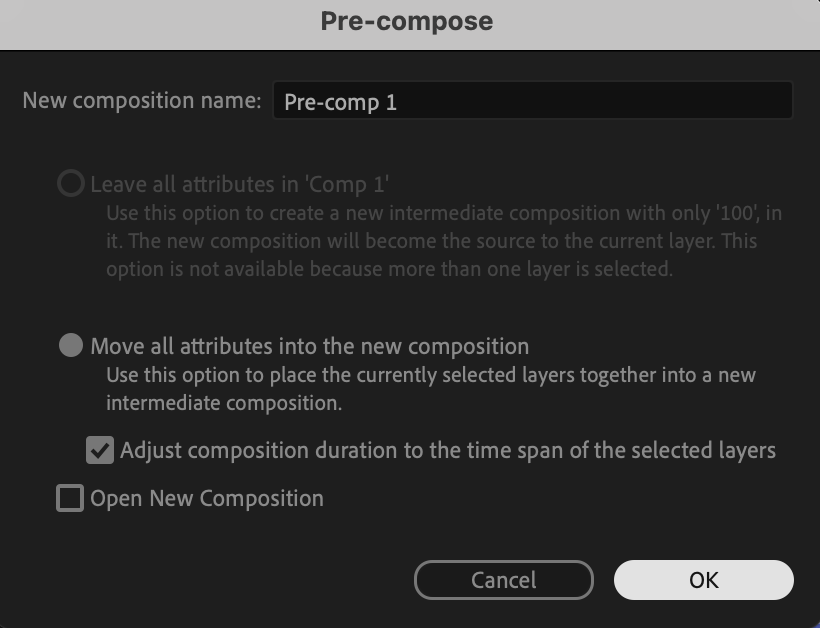
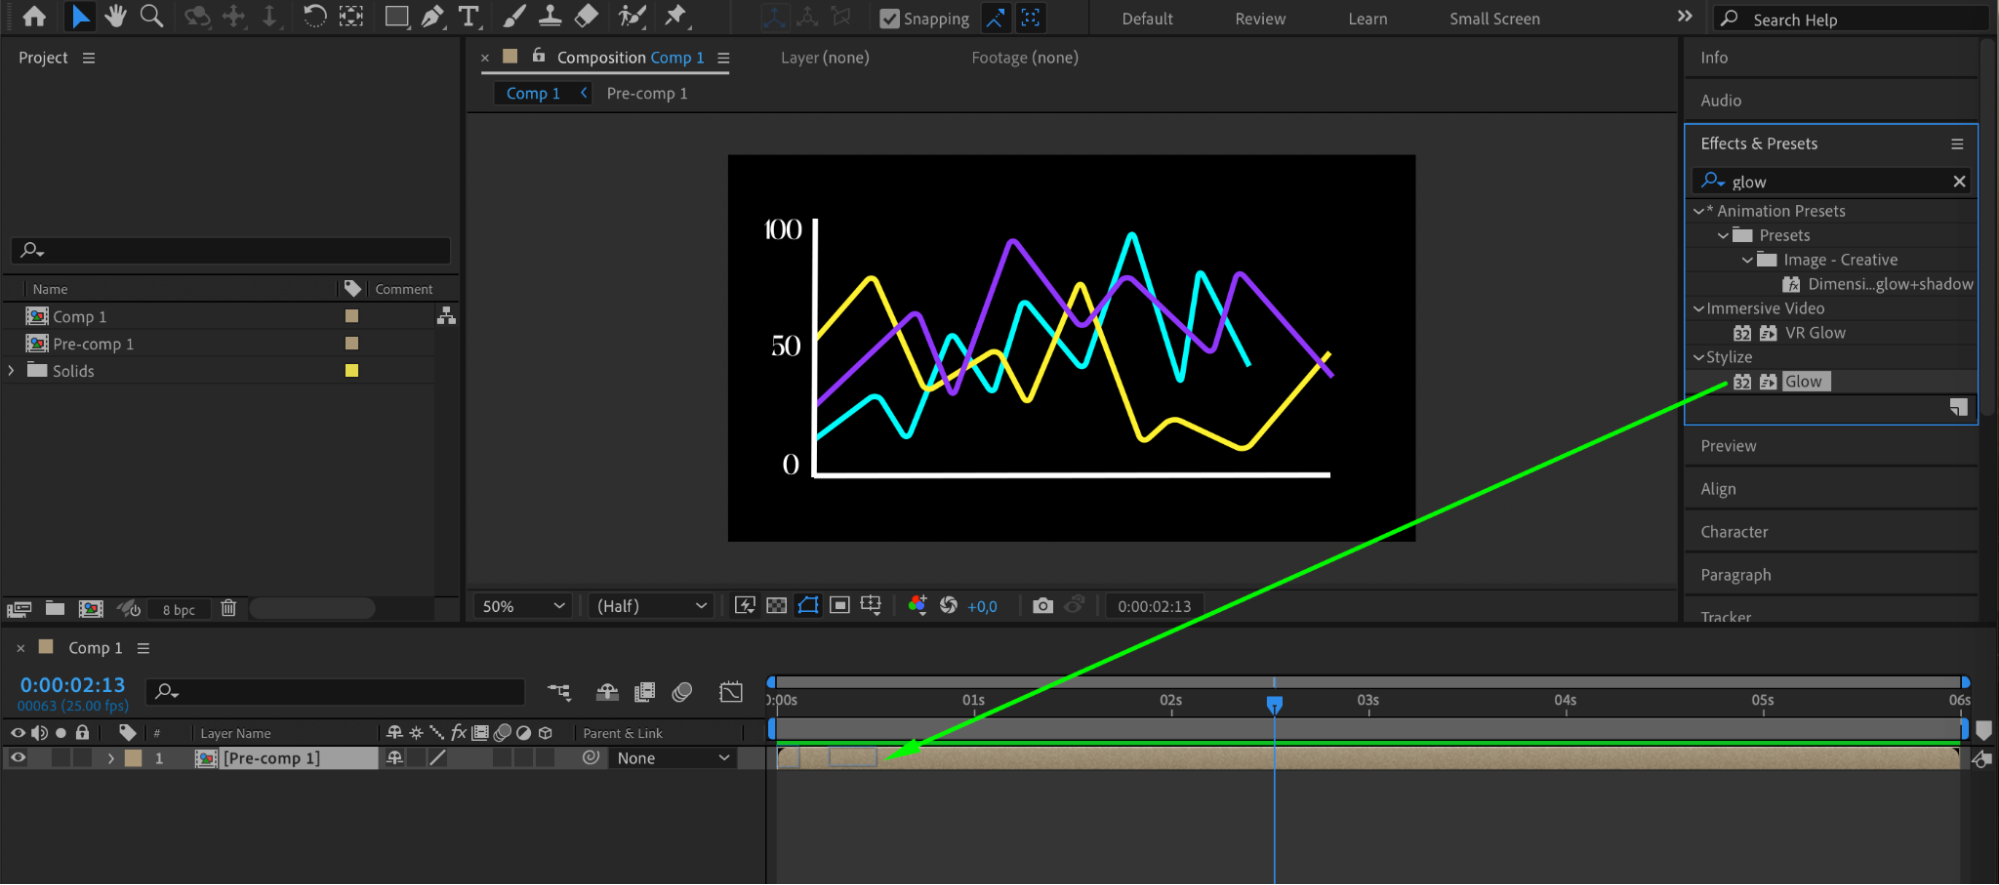
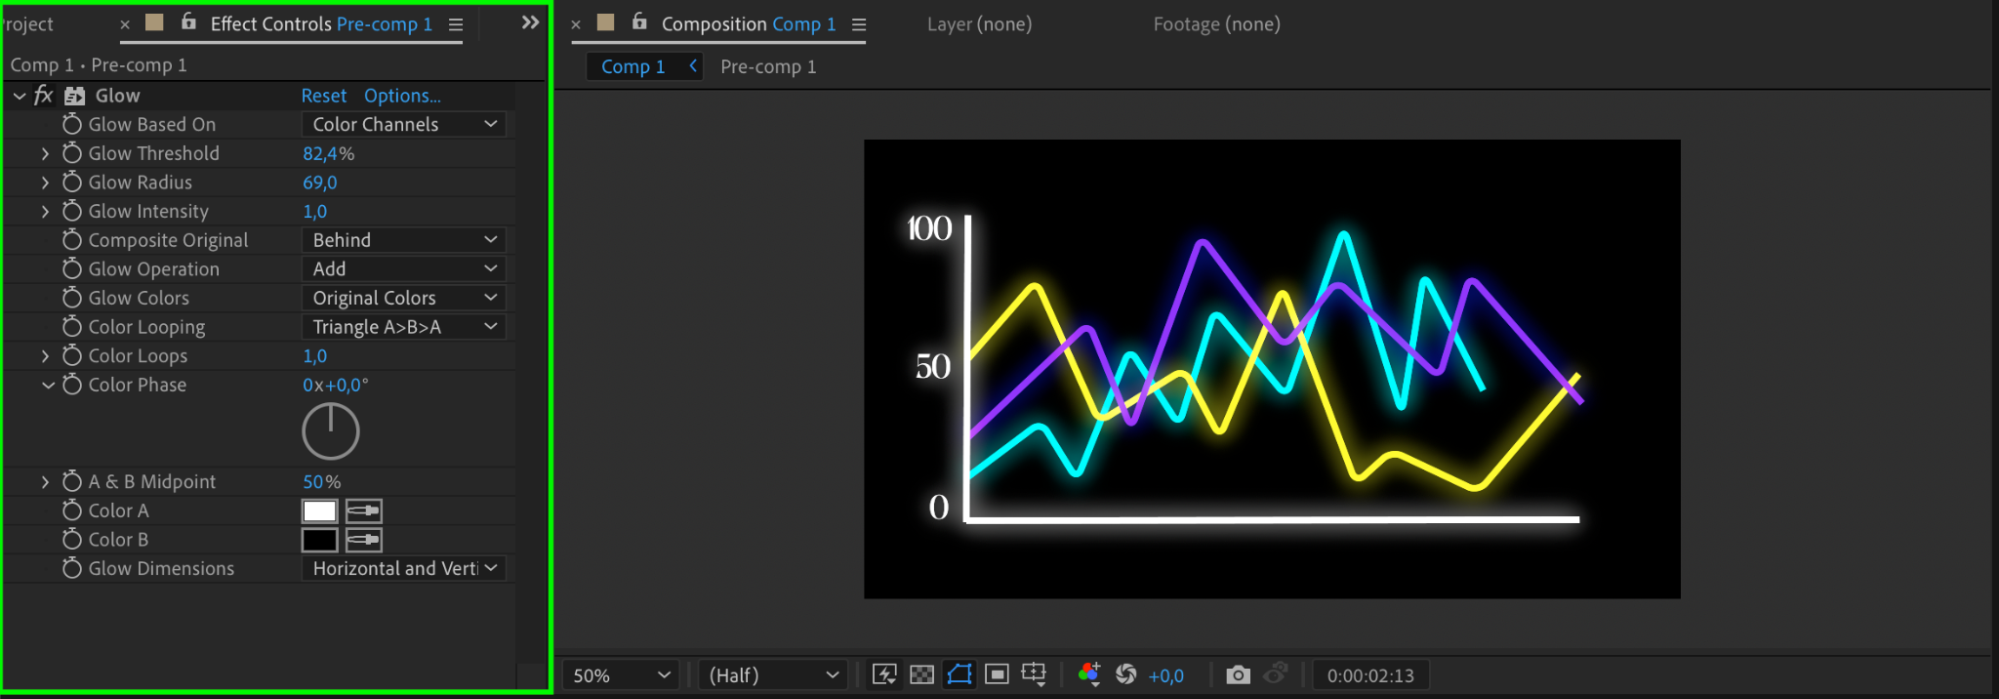
 Step 12: Pre-compose Layers
Get 10% off when you subscribe to our newsletter
Once your graph is complete, select all layers and pre-compose them for easier management. You can then apply various effects from the Effects & Presets panel to the pre-composition for additional styling.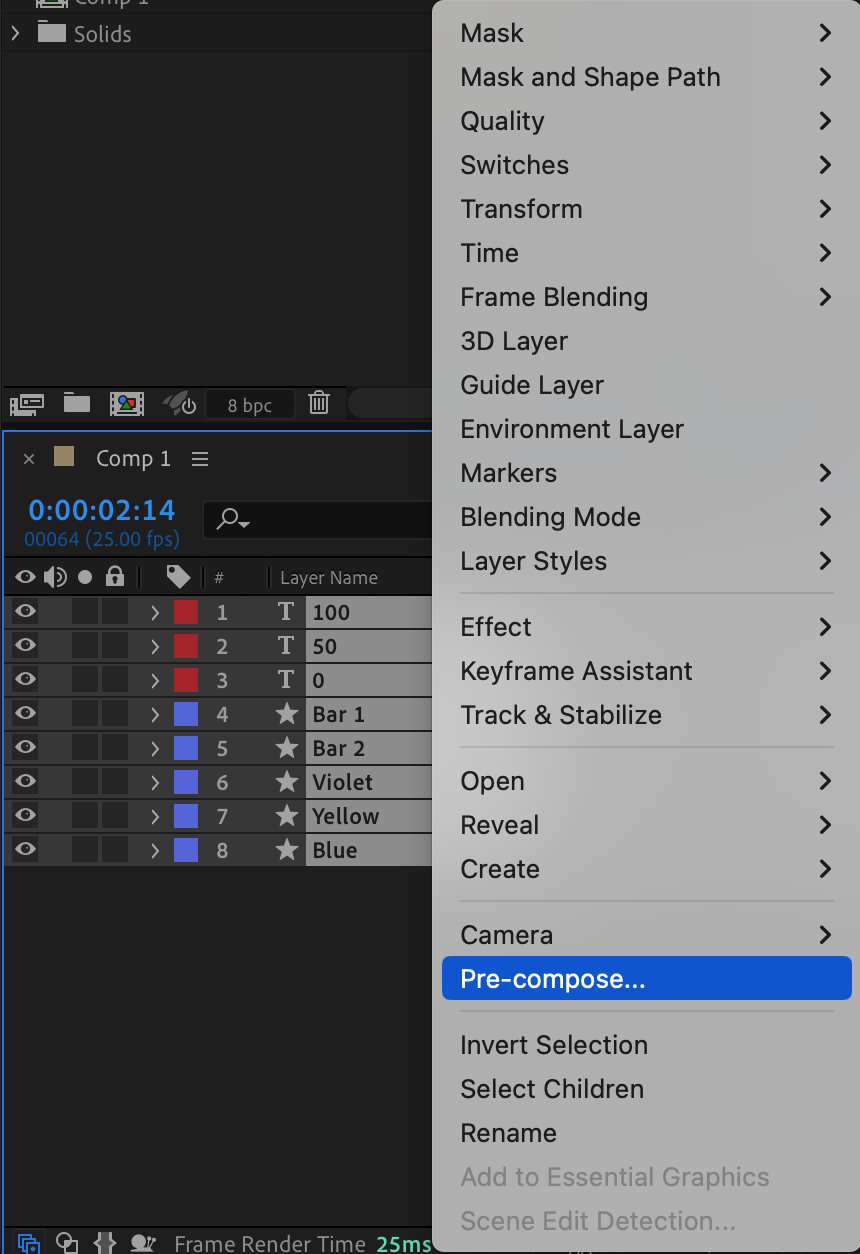
 Step 13: Preview Your Animation
Use the preview panel to review your animated graph. Ensure that all elements are animating as intended and make any necessary adjustments.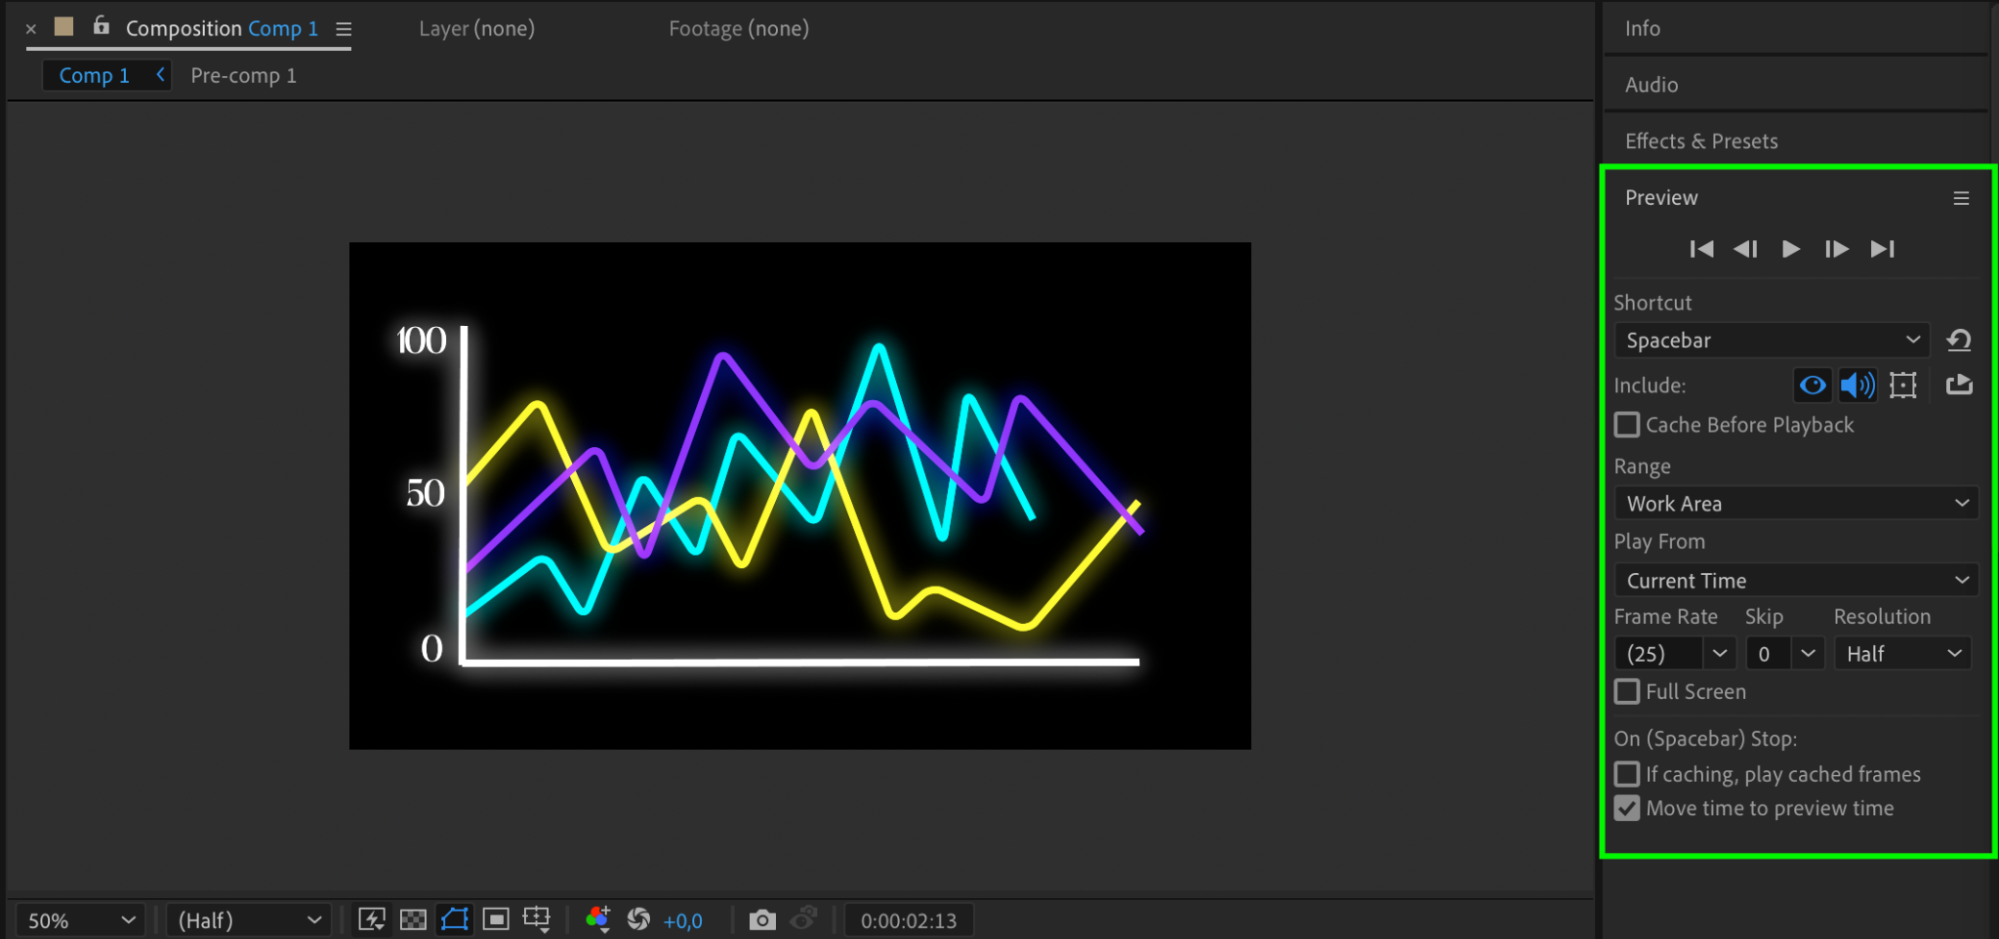 Conclusion
Animating graphs in After Effects allows you to present your data in a visually appealing and engaging way. Follow these steps to create stunning animated graphs that will captivate your audience. Don’t be afraid to experiment, get creative, and explore other After Effects features to take your graph designs to the next level. So, start creating your own animated graphs in After Effects today and let your data shine!
Our Bestsellers


